Varun Beverages Limited Research Report
|
Market Price |
Recommendation |
Target |
Time Horizon |
|
1,438 |
Buy |
1,690 |
1-Year |
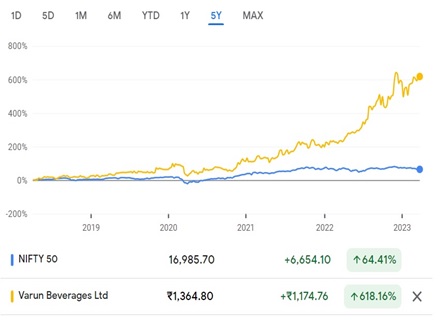
Varun Beverages Limited - Q4FY2022 REVIEW
Varun Beverages Limited reported net revenue of ₹2,266.45 crores for the quarter ended December 31, 2022, compared to ₹1,765.79 crores for December 30, 2021. Profit After Tax was ₹81.52 crores for the quarter ended December 31, 2022, compared to ₹32.59 crores during the corresponding quarter of the previous year, respectively.
STOCK DATA
|
52 Week H/L |
616.98/1442.25 |
|
Market Cap (crores) |
93,461 |
|
Face Value (₹) |
10.00 |
|
Book Value |
80.29 |
|
EPS TTM |
23.05 |
|
NSE Code |
VBL |
Varun Beverages Limited - OVERVIEW
-
Varun Beverages Ltd has invested 9.80% of the equity share capital (5.68% on a fully diluted basis) of Lone Cypress Ventures Private Limited, a special purpose company engaged in, among other things, supplying solar electricity to consumers in Uttar Pradesh.
-
Varun Beverages operates in six countries: three in the Indian Subcontinent (India, Sri Lanka, and Nepal) generate 85% of sales, while three in Africa (Morocco, Zambia, and Zimbabwe) contribute 15% for the fiscal year 2022.
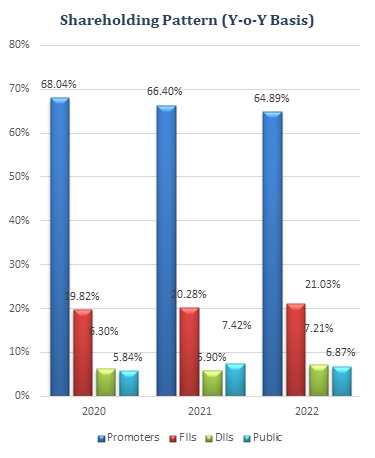
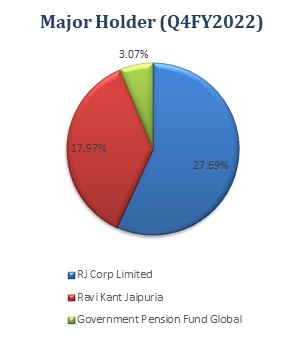
SHAREHOLDING PATTERN (%)
|
|
June-22 |
Sep-22 |
Dec-22 |
|
Promoter |
63.90 |
63.90 |
63.90 |
|
Public |
23.93 |
25.01 |
26.45 |
|
FII |
5.31 |
4.45 |
3.42 |
|
DII |
6.86 |
6.62 |
6.20 |
BENCHMARK COMPARISON
Beta: 0.65 |
Alpha: 50.27 |
Risk Reward Ratio: 1.40 |
Margin of Safety: 20% |
BUSINESS
-
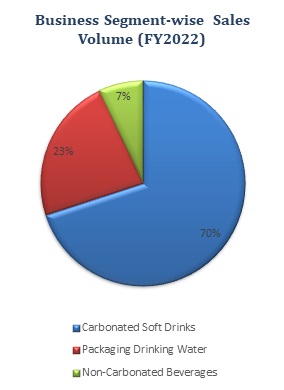
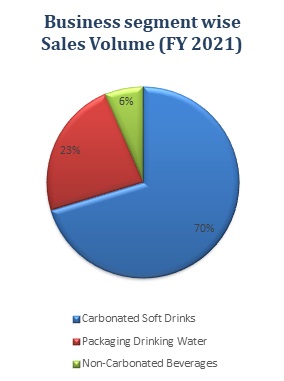
Varun Beverages Limited is a major player in the beverage industry and one of the world's largest PepsiCo franchisees (outside USA). The Company manufactures and sells a diverse range of carbonated soft drinks (CSDs) as well as a diverse range of non-carbonated beverages (NCBs), including packaged drinking water supplied under PepsiCo trademarks.
-
VBL purchased the franchise rights for Punjab, Chandigarh, Himachal Pradesh, and the remaining parts of Uttar Pradesh, Uttarakhand, and Haryana from PepsiCo in February 2015, along with four manufacturing units—one each in Panipat, Sathariya, Jainpur, and Bazpur.
-
In 2017 and 2018, VBL acquired Bihar and parts of the Madhya Pradesh, Chhattisgarh, Jharkhand, and Odisha territories from third-party bottlers. VBL has expanded its presence to 27 states and seven union territories after acquiring franchise rights for southern and western sub-territories from PepsiCo India and third-party bottlers in 2019. In September 2019, VBL increased its effective shareholding in Lunarmech Technologies Pvt Ltd, a manufacturer of plastic closures for PET bottles, to 55% from 35%.
-
VBL's PepsiCo CSD products include Pepsi, Pepsi Black, Mountain Dew, Sting, Seven-Up, Mirinda Orange, Seven-Up Nimbooz Masala Soda, and Evervess. Tropicana Slice, Tropicana Juices (100% and Delight), Seven-Up Nimbooz, Gatorade, and bottled drinking water under the trademark Aquafina are among the PepsiCo NCB products produced and distributed by the Corporation.
-
VBL has been associated with PepsiCo since the 1990s and has consolidated its business relationship with PepsiCo over the last two and a half decades by increasing the number of licensed territories and sub-territories covered by the Company, producing, and distributing a broader range of PepsiCo beverages, introducing various SKUs in the portfolio, and expanding the distribution network.
-
VBL has received franchises for several PepsiCo products in 27 Indian states and 7 union territories. India is the largest market, accounting for 80% of net revenue from operations in Fiscal 2022. VBL has also been granted the franchise for several PepsiCo products in Nepal, Sri Lanka, Morocco, Zambia, and Zimbabwe.
-
VBL entered into the agreement to distribute and sell Lays, Doritos, and Cheetos for PepsiCo in the territory of Morocco, and it also commenced commercial production of Kurkure Puffcorn at the manufacturing plant in Uttar Pradesh for PepsiCo in FY2022.
Varun Beverages Limited - SWOT ANALYSIS
STRENGTH
-
Key Player in Beverage Industry.
-
Symbiotic relationships with PepsiCo.
-
Strong business model.
-
FIIs have increased their shareholding.
WEAKNESS
-
capital-intensive business
-
Susceptibility to regulatory changes and client preferences
OPPORTUNITIES
-
Growing beverages and snacks consumption in an emerging market.
-
Further expansion through acquisition.
-
Increasing demand for healthy food and beverages.
THREAT
-
Changes in consumer tastes.
-
Increasing costs of raw materials could impact the profit of the company.
-
Regulatory risk.
BEVERAGE INDUSTRY ANALYSIS
-
After two years of disruption from the Covid-19 epidemic in the important summer season, the domestic soft drinks sector saw a year of significant expansion in CY 2022. The industry successfully reacted to changes in consumer behavior and demand caused by the epidemic, and it proceeded to offer new goods in line with changing customer tastes and preferences.
-
The resurrection of out-of-home channels, as well as pent-up demand from consumers returning to socializing, led to a large spike in demand. Furthermore, the market for energy drinks took up and emerged as a growth category, owing to a favorable demand environment and good performance.
-
Future development potential in the Indian drinks sector will be driven by further penetration into rural markets, an expanding demographic profile, and a growing middle-class population.
-
Also, when per capita income rises, people are prepared to spend more on luxury and specialized items. When more people relocate to cities and have more discretionary income, urbanization plays a vital influence in the industry's growth. Carbonates, juices, and bottled water are the three primary categories of the Indian soft drinks industry. Carbonates are the most valuable category.
-
The Indian soft drink industry is likely to develop significantly as consumption is expected to rise consistently due to a range of factors such as:
-
Positive demographic characteristics
-
Rapid urban growth and increasing earnings.
-
Rise in average expenditure per household.
-
Rural development and electrification.
-
Location.
-
Innovative product.
-
Varun Beverages Limited - FINANCIAL OVERVIEW
Varun Beverages Limited - QUARTERLY SUMMARY
|
Quarterly (INR in millions) |
Dec-22 |
Sep-22 |
Jun-22 |
Mar-22 |
Dec-21 |
|
Revenue from Operations |
22,572.01 |
32,483.05 |
50,175.75 |
28,674.77 |
17,649.36 |
|
Other income |
92.45 |
106.19 |
104.77 |
85.08 |
8.54 |
|
Total Income |
22,664.46 |
32,589.24 |
50,280.52 |
28,759.85 |
17,657.90 |
|
|
|
|
|
|
|
|
Total Expenditure |
21,293.54 |
27,024.58 |
39,200.31 |
24,677.99 |
16,866.41 |
|
EBIT |
1,370.92 |
5,564.66 |
11,080.21 |
4,081.86 |
791.49 |
|
|
|
|
|
|
|
|
Finance cost |
474.84 |
452.85 |
463.98 |
469.55 |
372.94 |
|
PBT Before share of Profit/(Loss) of Joint Venture |
896.08 |
5,111.81 |
10,616.23 |
3,612.31 |
418.55 |
|
|
|
|
|
|
|
|
Share of Profit/(Loss) of Joint Venture |
-0.06 |
- |
- |
- |
- |
|
PBT |
896.02 |
5,111.81 |
10,616.23 |
3,612.31 |
418.55 |
|
|
|
|
|
|
|
|
Tax Expenses |
80.78 |
1,156.96 |
2,596.12 |
901.37 |
92.65 |
|
PAT |
815.24 |
3,954.85 |
8,020.11 |
2,710.94 |
325.90 |
PROFIT AND LOSS STATEMENT (₹ in millions)
|
|
Dec-20 |
Dec-21 |
Dec-22 |
|
Revenue from Operations |
65,557.91 |
89,582.91 |
1,33,905.58 |
|
Other Income |
369.72 |
679.25 |
388.49 |
|
Total Income |
65,927.63 |
90,262.16 |
1,34,294.07 |
|
|
|
|
|
|
Cost of Goods sold |
27,639.37 |
40,346.60 |
62,611.56 |
|
Gross Profit |
38,288.26 |
49,915.56 |
71,682.51 |
|
|
|
|
|
|
Excise Duty |
1,056.49 |
1,350.61 |
2,174.16 |
|
Employee Benefits Expense |
8,897.36 |
10,076.99 |
12,166.42 |
|
Other Expenses |
15,946.01 |
21,262.26 |
29,072.39 |
|
EBITDA |
12,388.40 |
17,225.70 |
28,269.54 |
|
|
|
|
|
|
Depreciation and Amortisation Expense |
5,287.02 |
5,312.62 |
6,171.89 |
|
EBIT |
7,101.38 |
11,913.08 |
22,097.65 |
|
|
|
|
|
|
Finance Costs |
2,811.04 |
1,847.00 |
1,861.22 |
|
EBT before Share of Profit/(Loss) of Joint Venture and Associates |
4,290.34 |
10,066.08 |
20,236.43 |
|
|
|
|
|
|
Share of Profit/(Loss) of Joint Venture and Associates |
- |
- |
-0.06 |
|
EBT before Exceptional Items |
4,290.34 |
10,066.08 |
20,236.37 |
|
|
|
|
|
|
Exceptional Items |
665.29 |
- |
- |
|
EBT |
3,625.05 |
10,066.08 |
20,236.37 |
|
|
|
|
|
|
Tax Expense |
52.34 |
2,605.56 |
4,735.23 |
|
PAT Non-Controlling Interests |
3,572.71 |
7,460.52 |
15,501.14 |
|
|
|
|
|
|
Non-Controlling Interests |
-282.76 |
-520.00 |
-526.81 |
|
PAT |
3,289.95 |
6,940.52 |
14,974.33 |
|
|
|
|
|
|
EPS |
|
|
|
|
Basic |
7.60 |
10.69 |
23.05 |
|
Diluted |
7.60 |
10.69 |
23.05 |
|
|
|
|
|
|
Number of Shares |
|
|
|
|
Basic |
433.03 |
649.55 |
649.72 |
|
Diluted |
433.03 |
649.55 |
649.72 |
Balance Sheet (₹ in millions)
|
|
Dec-20 |
Dec-21 |
Dec-22 |
|
ASSETS: |
|
|
|
|
Non-Current Assets: |
|
|
|
|
Property, Plant and Equipment |
58,271.88 |
51,551.72 |
54,415.78 |
|
Capital Work-in-Progress |
668.15 |
4,966.08 |
6,066.32 |
|
Right of Use Assets |
242.30 |
5,727.99 |
9,155.01 |
|
Goodwill |
- |
242.30 |
242.30 |
|
Other Intangible Assets |
5,572.01 |
5,585.74 |
5,509.10 |
|
Investment in Associate and Joint Venture |
- |
- |
0.04 |
|
Finance Assets: |
|
|
|
|
Investments |
0.01 |
0.01 |
0.01 |
|
Loans |
1.21 |
- |
- |
|
Other Financial Assets |
417.89 |
420.63 |
486.80 |
|
Deferred Tax Assets |
110.18 |
24.07 |
- |
|
Other Non-Current Assets |
1,303.44 |
1,839.23 |
6,266.77 |
|
Total Non-Current Assets |
66,587.07 |
70,357.77 |
82,142.13 |
|
|
|
|
|
|
Current Assets: |
|
|
|
|
Inventories |
9,288.04 |
14,480.87 |
19,938.85 |
|
Financial Assets: |
- |
- |
- |
|
Trade Receivables |
2,417.97 |
2,212.49 |
2,993.38 |
|
Cash and Cash Equivalents |
1,045.58 |
1,507.50 |
1,543.32 |
|
Other Bank Balances |
854.92 |
1,858.72 |
1,309.35 |
|
Loans |
100.16 |
- |
- |
|
Others |
1,670.04 |
2,455.55 |
3,977.06 |
|
Current Tax Assets |
102.19 |
11.08 |
- |
|
Other Current Assets |
2,517.86 |
2,934.92 |
4,278.34 |
|
Total Current Assets |
17,996.76 |
25,461.13 |
34,040.30 |
|
|
|
|
|
|
Total Assets |
84,583.83 |
95,818.90 |
1,16,182.43 |
|
|
|
|
|
|
EQUITY AND LIABILITIES: |
|
|
|
|
Equity: |
|
|
|
|
Equity Share Capital |
2,886.89 |
4,330.33 |
6,495.50 |
|
Other Equity |
32,353.12 |
36,468.75 |
44,528.30 |
|
Total Equity to Owners of the Company |
35,240.01 |
40,799.08 |
51,023.80 |
|
|
|
|
|
|
Non-Controlling Interest |
647.88 |
1,167.89 |
1,131.07 |
|
Total Equity |
35,887.89 |
41,966.97 |
52,154.87 |
|
|
|
|
|
|
Liabilities: |
|
|
|
|
Non-Current Liabilities: |
|
|
|
|
Financial Liabilities |
|
|
|
|
Borrowings |
19,796.22 |
18,133.27 |
17,270.22 |
|
Lease Liabilities |
244.39 |
312.63 |
1,654.25 |
|
Provisions |
2,039.06 |
2,085.43 |
2,041.13 |
|
Deferred Tax Liabilities |
2,259.43 |
3,111.41 |
3,368.48 |
|
Other Non-Current Liabilities |
7.34 |
6.73 |
5.94 |
|
Total Non-Current Liabilities |
24,346.44 |
23,649.47 |
24,340.02 |
|
|
|
|
|
|
Current Liabilities: |
|
|
|
|
Financial Liabilities: |
|
|
|
|
Borrowings |
7,138.58 |
15,285.68 |
19,677.90 |
|
Lease Liabilities |
- |
136.02 |
235.77 |
|
Trade Payables: |
- |
- |
- |
|
Total Outstanding Dues of Micro and Small Enterprises |
93.70 |
342.85 |
659.11 |
|
Other Creditors |
5,020.15 |
6,774.68 |
7,583.50 |
|
Other Financial Liabilities |
8,543.51 |
3,929.66 |
5,593.90 |
|
Other Current Liabilities |
3,182.92 |
3,096.76 |
4,889.77 |
|
Provisions |
331.72 |
497.40 |
291.91 |
|
Current Tax Liabilities |
38.92 |
139.41 |
755.68 |
|
Total Current Liabilities |
24,349.50 |
30,202.46 |
39,687.54 |
|
|
|
|
|
|
Total Equity & Liabilities |
84,583.83 |
95,818.90 |
1,16,182.43 |
Cash Flow Statement (₹ in millions)
|
|
Dec-20 |
Dec-21 |
Dec-22 |
|
Net Profit Before Tax |
3,625.05 |
10,066.08 |
20,236.43 |
|
Net Cash from Operating Activities |
10,119.87 |
12,314.22 |
17,900.29 |
|
Net Cash Used for Investing Activities |
-4,710.96 |
-10,106.39 |
-17,045.98 |
|
Net Cash From (Used For) Financing Activities |
-5,737.17 |
-1,776.82 |
-179.42 |
|
Net Increase in Cash and Cash Equivalents |
-328.26 |
431.01 |
674.89 |
|
Cash And Cash Equivalents at The Beginning of The Year |
1,379.68 |
1,045.58 |
1,507.50 |
|
Cash And Cash Equivalents at The End of the Year |
1,045.58 |
1,507.50 |
1,543.32 |
Varun Beverages Limited - Ratio Analysis
|
|
Dec-20 |
Dec-21 |
Dec-22 |
|
Profitability Ratio |
|
|
|
|
Gross Profit |
58.40% |
55.72% |
53.53% |
|
EBITDA Margin |
18.90% |
19.23% |
21.11% |
|
EBIT Margin |
10.83% |
13.30% |
16.50% |
|
Pre-Tax Margin |
5.53% |
11.24% |
15.11% |
|
Net Profit Margin |
5.02% |
7.75% |
11.18% |
|
|
|
|
|
|
Return on Investment |
|
|
|
|
Return on Asset – ROA |
4% |
8% |
14% |
|
Return on Capital Employed – ROCE |
12% |
19% |
31% |
|
Return on Equity – ROE |
9% |
18% |
32% |
|
|
|
|
|
|
Liquidity Ratio (x) |
|
|
|
|
Current ratio |
0.74 |
0.84 |
0.86 |
|
Quick Ratio |
0.36 |
0.36 |
0.36 |
|
|
|
|
|
|
Turnover Ratio |
|
|
|
|
Receivables Turnover |
110.6 |
66.0 |
84.5 |
|
Inventory Turnover |
3.1 |
3.4 |
3.6 |
|
Payables Turnover |
5.7 |
6.8 |
8.7 |
|
Asset Turnover |
0.8 |
1.0 |
1.3 |
|
|
|
|
|
|
Solvency Ratio |
|
|
|
|
Debt to Equity |
0.75 |
0.80 |
0.71 |
|
Interest Coverage Ratio |
3 |
6 |
12 |
Varun Beverages Limited - Technical Analysis
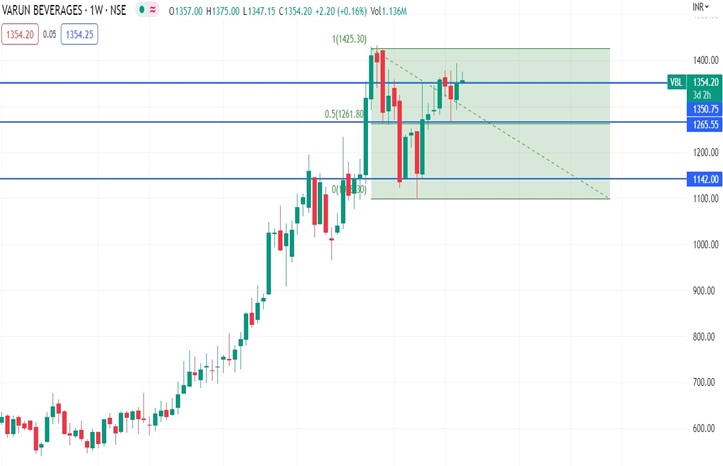
-
Stock is in upward trend on a monthly and weekly basis, with a support level of ₹1,261 and a resistance level of ₹1354.
-
One can accumulate this stock at current levels.
CONCALL (Q4FY2022)
-
In Q4 CY2022, revenue from operations adjusted for excise/GST increased by 27.7% year on year to Rs. 22,142 million. Sales volume increased by 17.8% in Q4 CY22 to 132 million cases, and overall sales volume increased by 40.9% to 802 million cases in CY2022, led by excellent performance in India and overseas territories.
-
In the balance sheet, net debt was Rs. 34,096 million on December 31, 2022, up from Rs. 30,053 million on December 31, 2021. During CY23, this growth was attributed to greenfield expansion in Rajasthan and Madhya Pradesh, as well as brownfield expansion at six factories in India.
-
During CY22, the Company invested in a variety of growth projects, including Rs. 6,300 million for greenfield development in Bihar and Jammu, as well as brownfield expansion in India and Rs. 2,500 million for brownfield expansion in Morocco and Zimbabwe.
-
The total net CAPEX estimated for CY23 is around 15,000 million. Its growth-oriented CAPEX will be predominantly funded by internal accruals, further reinforcing the financial company's strength.
-
The dairy industry's countrywide rollout is scheduled for 2024, with capacity doubling by the end of the current year. The market for energy drinks is expanding, and the company's Sting product should account for 10-15% of the total mix. The company is moving forward with cross-selling other products in Sting-only stores.
-
The corporation is seeking a 10-15% rise in the number of outlets and aspires to reach 3.5 million outlets. When the number of outlets increases, Visi Cooler additions will have to increase. The corporation is extending its distribution throughout all areas, with a particular emphasis on the East, West, and South. The newly acquired markets, such as South and West, are rising at a quicker rate.
-
Markets with limited penetration will expand significantly quicker. Energy drinks now account for about 15% of the beverage market in emerging economies. In India, sting accounts for only 10% of the total. Sting's performance has been unaffected by the competition's debut of an energy drink under the Thumbs Up name
Recommendation Rationale
-
Strong distribution network and diversified product portfolio:
-
Varun Beverages Limited is the second largest PepsiCo franchisee (outside the USA) having operations spanning across 6 countries and 2 continents with access to a combined population of 1.4 million.
-
It has strengthened its infrastructure and networks by having more than 110 depots, 2400+ primary distributors, 2500+ distribution vehicles, and 9.25 lakhs Visi Coolers.
-
It has a diversified product portfolio which includes carbonated soft drinks, non-carbonated drinks, and packaged drinking water.
-
-
Capex spending and expansion plans will help margins increase in the future:
-
VBL employs an organic and inorganic capacity expansion strategy in both domestic and international markets. PepsiCo India and third-party bottler areas were acquired in the first half of 2019, with the full effect projected in 2020. Nonetheless, the pandemic slowed volume and market penetration ramp-up in 2020 and 2021. Once things got settled down in 2022, VBL gained from economies of scale in these adjacent areas.
-
During FY22, the Company spent Rs. 6,300 million on greenfield development in Bihar and Jammu, as well as brownfield expansion in India and Rs. 2,500 million on brownfield expansion in Morocco and Zimbabwe.
-
-
Strong Financial Profile:
-
The company’s sales volume has improved and strengthened, with a growth of 24% CAGR for FY2018-2022.
-
VBL’s debt-to-equity ratio has reduced from 0.85 to 0.71 times in FY2022.
-
The company has been continuously investing and expanding its business across the territories over the years which has helped the company to improve its revenue and profit from FY 2015.
-
-
Increasing Temperature:
-
Demand for the cold-drinks is expected to increase due to the early onset summer season and high temperatures.
-
Demand for soft drinks has started improving in semi-urban and rural areas also.
-
The company is also penetrating newly acquired areas in south and west India.
-
Valuation
-
Varun Beverages Limited has shown revenue growth of 26% CAGR for FY2018-2022.
-
Net Profit has shown growth of 50% CAGR for FY2018-2022.
-
In FY2020, the finances of the company were impacted, due to the lockdowns enacted to limit the spread of COVID-19, the company’s performance during the seasonally strong period of the April to June quarter was considerably damaged.
-
The company’s ROE and ROCE are 33% & 31% for FY2022.
-
We estimate the company could generate higher revenue and net profit for the following FY 2023, comparable to the prior year, based on the company's present performance in FY 2022.
-
To project income for the fiscal years 2023–2027, we used data from the previous five years (2018–2022).
Estimated Income Statement (₹ in millions)
|
|
Mar-23 |
Mar-24 |
Mar-25 |
Mar-26 |
Mar-27 |
|
|
2023-E |
2024-E |
2025-E |
2026-E |
2027-E |
|
Revenue |
1,72,901.45 |
2,22,621.53 |
2,86,654.33 |
3,69,121.53 |
4,75,331.85 |
|
COGS |
79,162.40 |
1,01,963.37 |
1,31,331.66 |
1,69,158.83 |
2,17,881.28 |
|
Gross Profit |
93,739.05 |
1,20,658.15 |
1,55,322.67 |
1,99,962.69 |
2,57,450.56 |
|
Employee Expenses |
17,535.97 |
22,586.81 |
29,092.44 |
37,471.87 |
48,264.82 |
|
Other Expenses |
37,446.05 |
48,231.55 |
62,123.58 |
80,016.90 |
1,03,063.99 |
|
EBITDA |
38,757.04 |
49,839.79 |
64,106.65 |
82,473.92 |
1,06,121.76 |
|
Depreciation |
6,074.54 |
6,612.41 |
7,418.28 |
8,558.78 |
10,120.73 |
|
EBIT |
32,682.50 |
43,227.38 |
56,688.37 |
73,915.15 |
96,001.03 |
|
Financial Cost |
2,516.88 |
3,405.05 |
4,538.83 |
5,989.79 |
7,850.02 |
|
EBT |
30,165.62 |
39,822.33 |
52,149.55 |
67,925.36 |
88,151.02 |
|
Tax expenses |
7,114.96 |
9,625.71 |
12,830.78 |
16,932.50 |
22,191.17 |
|
PAT |
23,050.66 |
30,196.63 |
39,318.76 |
50,992.86 |
65,959.85 |
Disclaimer: This report is only for the information of our customer Recommendations, opinions, or suggestions are given with the understanding that readers acting on this information assume all risks involved. The information provided herein is not to be construed as an offer to buy or sell securities of any kind.
- Share :


Post a Comment
|
DISCLAIMER |
This report is only for the information of our customers. Recommendations, opinions, or suggestions are given with the understanding that readers acting on this information assume all risks involved. The information provided herein is not to be construed as an offer to buy or sell securities of any kind. ATS and/or its group companies do not as assume any responsibility or liability resulting from the use of such information.