Vardhman Textiles
Vardhman Textiles Limited - Background
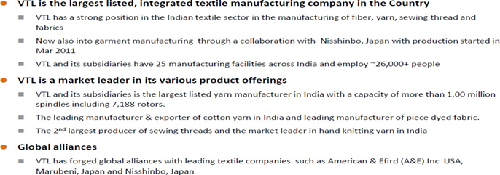
Vardhman Textiles Limited is an integrated textile manufacturing company. The company is engaged in manufacturing of cotton yarn, synthetic yarn, woven fabric, sewing thread, acrylic fiber, tow and Garments. The Company operates through two segments: Textiles and Fibre. Its Textiles segment includes yarn, fabric, sewing thread and garments. Its yarn business delivers a range of specialized greige and dyed yarns, such as cotton, polyester, acrylic and other blends. It is a manufacturer and exporter of cotton yarn, as well as manufacturer of piece- dyed fabric. It also manufactures value added products, such as organic cotton, melange, core spun yarns, ultra yarns, gassed mercerized, super fine yarns, slub and cellulose yarns, and fancy yarns for hand knitting. It provides fabrics for tops and bottoms to apparel makers. The Company has approximately 20 ma nufacturing facilities and over 1,800 retail outlets across India. Source: Reuters
|
BSE Code |
502986 |
|
NSE Code |
VTL |
|
Reuters Code |
VARTI.NS |
|
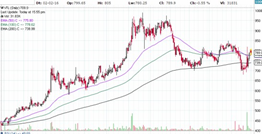
CMP (as on 02/02/2016) |
788.00 |
|
Stock Beta |
0.33 |
|
52 Week H/L |
990/427 |
|
Market Cap (Cr) |
5015.77 |
|
Equity Capital (Rs cr) |
62.52 |
|
Face Value (Rs) |
10 |
|
Average Volume |
31831 |
|
|
|
|
Shareholding Pattern (%) |
|
|
Promoters |
61.92 |
|
Non Institutions |
38.08 |
|
Grand Total |
100 |
Vardhman Textiles Limited - Investment Rationale
-
Aggressive modernization plans
-
Exports growth to continue
-
GST the next big trigger
-
Consistent growth and sound financials
-
Strong clientele and Value added products
Vardhman Textiles Limited - Risks and Concerns
-
Competition from unorganized sector
-
Dependence on end user industry
-
Cost fluctuations
Conclusion & Recommendation
Vardhman Textiles Ltd (VTL) being a dominant player in domestic and international cotton and textile with its high quality products and wise market reach in both India and abroad. With aggressive technology up gradation plans, debt reduction and growth opportunities we expect company to outperform the industry in the both medium term and long term future.
At the current market price of Rs.788 the stock is trading at ~6.4 FY17E EPS. Investors could buy the stock at CMP and add on dips to around Rs.740 to Rs.730 levels (~5.9x FY17E EPS) for our sequential targets of Rs.890 and Rs.960 (~7.2x to ~7.7x FY17E EPS).
Vardhman Textiles Limited - Financial Summary
|
Particulars (Rs. in Crs) |
FY2013 |
FY2014 |
FY2015 |
FY2016E |
FY2017E |
|
Net Sales |
4972.07 |
6166.43 |
6785.96 |
6695.46 |
7030.34 |
|
Operating Profit |
1023.64 |
1537.17 |
1284.01 |
1432.41 |
1594.34 |
|
PAT |
356.39 |
718.35 |
400.21 |
653.45 |
774.15 |
|
EPS (Rs.) |
57.00 |
114.90 |
64.01 |
104.52 |
123.82 |
|
PE (x) |
13.82 |
6.86 |
12.31 |
7.54 |
6.36 |
Vardhman Textiles Limited - Business Profile
Company structure
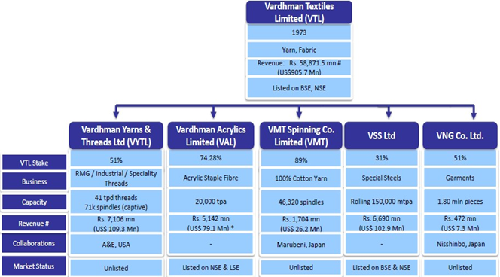
Subsidiaries and Joint ventures
Vardhman Acrylics Limited
Vardhman Acrylics Limited is an India-based textiles company. The Company's principal business activity is the manufacturing of man-made fibers. The Company operates through Acrylic Fibre & Tow segment. The Company's products range includes non-shrinkable, high shrinkage, medium shrinkage, very high shrinkable, tow 123, 131, 139 K-Tex, a staple for open-end, soft hand and water absorbent. Its products are marketed under the brand name of VARLAN. The Company's products are used in various applications, such as hosiery, including sweater, muffler, scarf and shirting; weaving, including shawl, lohi, check shirt, and ladies suit; home furnishing, including mink blanket, woven blanket, table mat, and bath mat; industrial, including industrial filter, non-wovens and tents, and others, including fur fabrics, soft toys, and rugs. The Company has approximately 18,000 tons per annum (TPA) acrylic staple fiber and two production plant at Jhagadia District, Bharuch in the state of Gujarat, India.
Vardhaman Special Steels Limited
Vardhaman Special Steels Limited is an India-based company, which is engaged in the manufacturing of billet, steel bars and rods, and bright bars of various categories of special and alloy steels. The Company supplies a range of special and alloy steel hot-rolled bars for engineering, automotive, tractor, bearing, and allied industries. The Company's products include Plain Carbon Steel, Carbon Manganese Steel, Chrome Steel, Chrome Manganese Steel, steel composite material (SCM) Category Steel /Chrome-Moly Steel, Nickel Chrome/Nickel Chrome Moly Steel, Chrome-Moly Steel, Chrome/Ni-Moly Steel, Moly Steel, Boron Steel, Micro Alloyed Steel, Vanadium Steel, Nitriding Steel, Ball Bearing Steel, Free/Semi Free Cutting Steel, Spring Steel, and High Titanium Steel. Its technology includes steel melting, rolling mill, bright bar shop, heat treatment, non-destructive testing, and process flow. It has exported over 4,000 tons of alloy steel. It has billet production of over 122,000 metric tons.
Vardhman Nisshinbo Garments Limited
Vardhman Nisshinbo Garments Limited is a joint venture between Vardhman Group and Japan-based Nisshinbo Textiles Inc. The Company is into manufacturing high-end premium quality shirts for large retail brands. Vardhman Nisshinbo Garments Co. Ltd is equipped with world-class machines from Japan, Germany, the USA, China, etc., and capable of manufacturing over 1.8 million shirts per annum. VNGL is one of the Post Cure Wrinkle Free shirts manufacturers in India.A hallmark of quality, VNGL has earned the International Compliance Certificates through WCA and SEDEX Certification. VNGL is also a Green Channel Certification holder from top apparel brands of India.
Vardhman Yarns & Threads Limited (VYTL)
Vardhman Yarns & Threads Limited (VYTL) is a joint venture between Vardhman Textiles Ltd. India and American & Efird LLC of USA engaged in manufacturing a range of specialty threads across different applications. This strategic joint venture leverages the strengths of both companies to expand thread sales in India’s rapidly growing sewn products market and further expands American & Efird LLC’s presence in important Asian markets.
VMT Spinning Company Ltd.
The company entered into a joint venture agreement with M/s. Marubeni Corporation & Toho Rayon Co. Ltd., Japan for setting up a 100% EOU to manufacture cotton yarn with a capacity of 25,000 spindles at Baddi, HP.
Investment Rationales
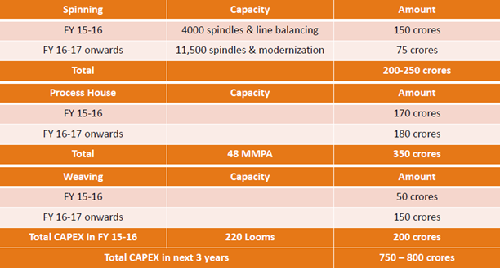
Aggressive modernization plans
VTL have planned a capex of Rs.750-800 crore till FY 16-17, in which company plans to increase the number of sprinkles and life balancing and modernization of the current machines will help the company to deliver higher margins spread across various segments. The current deprecation amounts for ~Rs.130 crores and capex plans in place will help the company to reduce the depreciation expenses. It will help the company to deliver EBITA margins between 18-23% in the forthcoming years and even higher margins when the capex is fully completed.
Growth prospects of the economy
India is second largest producer of cotton in the world. It produces 23 percent of the world’s total cotton produce. Per capita consumption of cotton in North America is about 31 kgs., West Europe is 22 kgs., China is at 17 kgs., and India is about 7.5 kgs. Whereas, the world’s average is 11 kgs. The growing world’s population, increase in consumption of textiles in the emerging economies will drive polyester consumption at par with cotton. Organized retailing in India is currently at 5% and it is expected to grow up to 24% by the year 2020. The 40% of the demand of organized retailing comprises of apparel and textile, therefore increase in organized retailing space will exceptionally impact the apparel and textile demand. This growth will be further supported by the higher disposable income of the people and increase in working women to 32% by 2020 compared to 26% in 2010. Urbanization is expected to grow to 40% by 2031 contributing 75% of the GDP. During the last decade the middle income group population in India has increased 4 folds. Even the earning population (age 15-60) has grown to 60% further boosting the domestic consumption. The sustainable real GDP growth rate is about ~7.5-8%, sustained by increasing industrial output, rising disposable income and increasing nuclear families have supported construction activities thereby driving the demand for textiles.
Exports growth to continue
Exports are likely to continue to show a positive growth trend in the coming years driven by the improving economic outlook of buyer countries. India has been able to gain out of higher wages, political instability and work place accidents in other apparel exporting nations. Although India has a small share in the global textile trade, it is well positioned to gain from weak input prices and growing demand for apparels and made-ups. India’s apparel exports to the US grew 8% yoy in 2014 to USD956m (source: OTEXA), compared with negative 1% growth of apparel exports from China to the US. Lower labor cost (China: USD 3.00 per operator per hour vs India’s USD 1.12 in 2014), captive power coupled with steady supply at competitive rates and availability of raw materials (cotton) at lower cost than China have helped India’s textiles manufacturers keep their costs lower than peers The trends, if sustained in coming years, are likely to improve the financial metrics of garment manufacturers. VTL has ~35% of revenue comes from exports to more than 65 countries along with diversification in higher value-added products are likely to benefit from the tailwinds of input price reduction.
GST the next big trigger
The current taxes vary from 4% to 12% based on these categories. Further, textile sector is dominated by unorganized players who are given tax exemptions on the basis of size of their operations. With the implementation of GST, there will be a uniform rate of tax which will result in:
-
Blocked input taxes will be eliminated as GST is a consumption tax
-
Zero rating on exports under GST will boost exports further without the need for explicit subsidy schemes
-
Level-playing field will be provided to all textile segments Integration of production will be encouraged resulting in increased efficiency
-
Goods movement within the states will also be much easier as lot of local state taxes which are levied on the borders of states which inhibit free movement of goods will be removed. This will help in improving the productivity & efficiency of the textile industry as now more factories/manufacturing units can be set up in various textile hubs across India without worrying for various state taxes which were earlier levied indirectly
Vardhman Textiles Ltd (VTL) with given scale of operation is expected to be a key beneficiary from the implementation of GST.
Consistent growth and sound financials
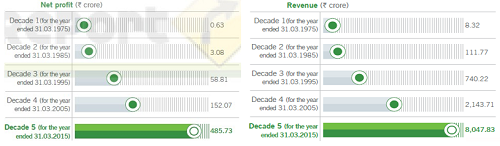
Vardhman Textiles Ltd (VTL) plans to repay debts in excess of Rs.1,250 crore over the next 24 months (about Rs.700 crore in 2015-16 and about Rs.550 crore in 2016- 17). Vardhman Textiles Ltd - VTL’s investments in liquid assets of Rs.680.30 cr as on March 31, 2015 which can be liquidated for business growth. It also has Rs.3312.77 which acan be used for further expansion plans
Strong clientele and Value added products
Vardhman Textiles Limited (VTL) business is skewed towards value-added products – for yarns and fabrics. It provides one of the widest product baskets (yarns and fabrics), graduating it into a one-stop solutions provider. It also focuses on exports of Value Added Products continued and the contribution of Value Added Products in Total Exports of the financial year 2014-15 is around 24%. It is one of the largest cotton yarn exporters to quality-conscious markets (EU, US, and the Far East). Approximately 70% of the yarn revenues are relationship-based, providing long-term revenue visibility. It has more than 350 well-established clients, GAP, H& M, Uniqlo, S’ Oliver, Benetton, etc to name a few. Most of the clients will act as quasi partners to the Vardhman Textiles Ltd (VTL), with prospects of the textile industry being bright will help the company to capitalize on the growth prospects of the industry both in India and abroad.
Industry Overview
Introduction
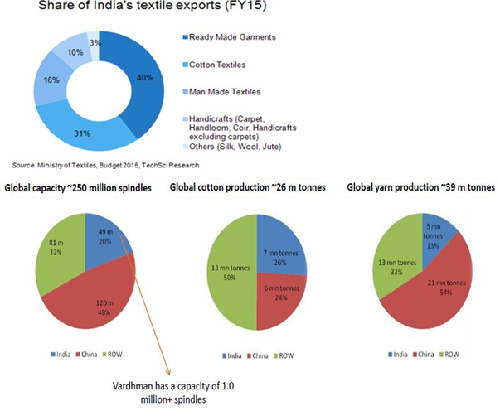
India’s textiles sector is one of the oldest industries in the Indian economy dating back several centuries. Even today, the textiles sector is one of the largest contributors to India’s exports with approximately 11 percent of total exports. The textiles industry is also labor-intensive and is one of the largest employers. The industry realized export earnings worth US$ 41.4 billion in 2014-15, a growth of 5.4 percent, as per The Cotton Textiles Export Promotion Council (Texprocil). The textile industry has two broad segments. First, the unorganized sector consists of handloom, handicrafts, and sericulture, which are operated on a small scale and through traditional tools and methods. The second is the organized sector consisting of spinning, apparel, and garments segment which apply modern machinery and techniques such as economies of scale.
The Indian textiles industry is extremely varied, with the hand-spun and hand-woven textiles sectors at one end of the spectrum, while the capital-intensive sophisticated mill's sector at the other end of the spectrum. The decentralized power looms/ hosiery and knitting sector form the largest component of the textiles sector. The close linkage of the textile industry to agriculture (for raw materials such as cotton) and the ancient culture and traditions of the country in terms of textiles make the Indian textiles sector unique in comparison to the industries of other countries. The Indian textile industry has the capacity to produce a wide variety of products suitable to different market segments, both within India and across the world.
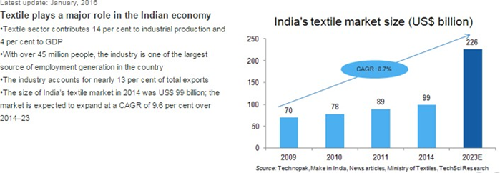
Market Size
The Indian textiles industry, currently estimated at around US$ 108 billion, is expected to reach US$ 223 billion by 2021. The industry is the second largest employer after agriculture, providing employment to over 45 million people directly and 60 million people indirectly. The Indian Textile Industry contributes approximately 5 per cent to India’s gross domestic product (GDP), and 14 per cent to overall Index of Industrial Production (IIP). The Indian textile industry has the potential to reach US$ 500 billion in size according to a study by Wazir Advisors and PCI Xylenes & Polyester. The growth implies domestic sales to rise to US$ 315 billion from currently US$ 68 billion. At the same time, exports are implied to increase to US$ 185 billion from approximately US$ 41 billion currently.
Indian Scenario
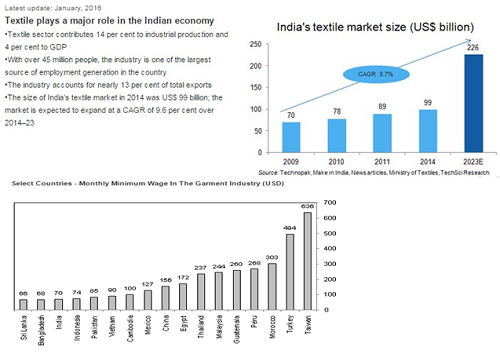
India, Bangladesh and Vietnam will benefit the most from the Chinese textile decline over the medium term. Global cotton consumption will record deep changes in the coming years, with China's share of global cotton demand decreasing from 33% in 2014 to 30% in 2019, while India will increase its share from 21% to 24% over the same period. The competitiveness of the textile sector in these three countries will support the sector's domestic and foreign investment as well as exports. These include attractive demographic trends and an abundance of low-cost labour Bangladesh's minimum wage in the garment industry is one of the lowest in the world, as its monthly wage is USD68, compared with USD156 in China and USD494 in Turkey. The emerging textile sectors will also be helped by the implementation of supportive government policies in the coming years. India's Prime Minister Narendra Modi has pledged to boost manufacturing in the country, including textiles, and launched the 'Make In India' campaign in September 2014, aimed at reducing red tape and improving the business environment. This is likely to attract investment from large textile retail brands in search of more socially responsible manufacturing standards.
Road Ahead
The future for the Indian textile industry looks promising, buoyed by both strong domestic consumption as well as export demand. With consumerism and disposable income on the rise, the retail sector has experienced rapid growth in the past decade with the entry of several international players like Marks & Spencer, Guess, and Next into the Indian market. The organized apparel segment is expected to grow at a Compound Annual Growth Rate (CAGR) of more than 13 percent over a 10-year period.
Risks and Concerns
Competition from unorganized sector
There are large number unorganized players in textile and cotton industry delivering products at different standards. VTL is exposed to high completion from these players both in domestic and international markets.
Dependence on end user industry
VTLs majority revenue comes from selling its products to the various companies and brands. So the VTL’s performance over dependant on end user industries demands.
Cost fluctuations
Cost of raw materials especially cotton contributes a significant share in the cost of production for VTL products and rupee depreciation would increase cost of imports, which in turn, could affect profitability.
Financials
Quarterly financial review
-
66% year on year (YoY) growth in consolidated net profit at Rs 161 crore for the third quarter ended December 31, 2015 (Q3) due to lower raw material cost. It has registered a net profit of Rs 97 crore in the same quarter last fiscal.
-
Net sales grew less than 1% at Rs 1,710 crore against Rs 1,697 crore in previous year quarter, while raw material cost declined by 13% at Rs 737 crore on year-on-year basis.
-
Earnings before interest, tax, depreciation and amortization (EBITDA) margin stood at 20.4% expanded by 363 basis points (bps) YoY and 100 bps on sequential basis.
Q3FY16
|
|
3rdQtr201512 |
3rdQtr201412 |
VAR % |
3rdQtr201512 |
2ndQtr201509 |
VAR % |
|
Gross Sales |
1710.1 |
1697.13 |
0.8 |
1710.1 |
1634.97 |
4.6 |
|
Excise Duty |
0 |
0 |
0 |
0 |
0 |
0.0 |
|
Net Sales |
1710.1 |
1697.13 |
0.8 |
1710.1 |
1634.97 |
4.6 |
|
Other Operating Income |
10.33 |
39.29 |
-73.7 |
10.33 |
12.32 |
-16.2 |
|
Other Income |
0 |
0 |
0 |
0 |
0 |
0 |
|
Total Income |
1720.43 |
1736.42 |
-0.9 |
1720.43 |
1647.29 |
4.4 |
|
Total Expenditure |
1369.51 |
1445.2 |
-5.2 |
1369.51 |
1328.45 |
3.1 |
|
PBIDT |
350.92 |
291.22 |
20.5 |
350.92 |
318.84 |
10.1 |
|
Interest |
21.21 |
26.01 |
-18.5 |
21.21 |
22.09 |
-4.0 |
|
PBDT |
329.71 |
265.21 |
24.3 |
329.71 |
296.75 |
11.1 |
|
Depreciation |
98.17 |
131.18 |
-25.2 |
98.17 |
99.67 |
-1.5 |
|
PBT |
231.54 |
134.03 |
72.8 |
231.54 |
197.08 |
17.5 |
|
Tax |
70.12 |
36.94 |
89.8 |
70.12 |
58.99 |
18.9 |
|
Reported Profit After Tax |
161.42 |
97.09 |
66.3 |
161.42 |
138.09 |
16.9 |
|
Minority Interest After NP |
14.95 |
10.44 |
43.2 |
14.95 |
12.1 |
23.6 |
|
Profit/Loss of Associate Company |
1.48 |
-1.24 |
219.4 |
1.48 |
-0.3 |
-593.3 |
|
NP after Minority Int& P/L Asso.Co. |
147.95 |
85.41 |
73.2 |
147.95 |
125.69 |
17.7 |
|
|
|
|
|
|
|
|
|
PBIDTM(%) |
20.52 |
17.16 |
19.6 |
20.52 |
19.5 |
5.2 |
|
PBDTM(%) |
19.28 |
15.63 |
23.4 |
19.28 |
18.15 |
6.2 |
|
PATM(%) |
8.65 |
5.03 |
72 |
8.65 |
7.69 |
12.5 |
Profit and Loss Account as per rough estimates
|
|
FY13 |
FY14 |
FY15 |
FY16E |
FY17E |
|
Gross Sales |
4972.07 |
6166.43 |
6785.96 |
6695.46 |
7030.34 |
|
Excise Duty |
0 |
0 |
0 |
0.00 |
0.00 |
|
Net Sales |
4972.07 |
6166.43 |
6785.96 |
6695.46 |
7030.34 |
|
Other Operating Income |
49.01 |
73.92 |
166.24 |
160.27 |
188.27 |
|
Other Income |
0 |
0 |
0 |
0.00 |
0.00 |
|
Total Income |
5021.08 |
6240.35 |
6952.2 |
6855.73 |
7218.61 |
|
Total Expenditure |
3997.44 |
4703.18 |
5668.19 |
5423.32 |
5624.27 |
|
PBIDT |
1023.64 |
1537.17 |
1284.01 |
1432.41 |
1594.34 |
|
Interest |
177.09 |
151.12 |
124.88 |
99.03 |
85.32 |
|
PBDT |
846.55 |
1386.05 |
1159.13 |
1333.37 |
1509.02 |
|
Depreciation |
295.31 |
335.48 |
532.21 |
363.82 |
400.27 |
|
Minority Interest Before NP |
0 |
0 |
0 |
0.00 |
0.00 |
|
PBT |
551.24 |
1050.57 |
626.92 |
969.55 |
1108.75 |
|
Tax |
168.22 |
282.1 |
176.52 |
276.32 |
293.82 |
|
Fringe Benefit Tax |
0 |
0 |
0 |
0.00 |
0.00 |
|
Deferred Tax |
0 |
0 |
0 |
0.00 |
0.00 |
|
Reported Profit After Tax |
383.02 |
768.47 |
450.4 |
693.23 |
814.93 |
|
Minority Interest After NP |
28.18 |
47.17 |
45.44 |
45.97 |
48.62 |
|
Profit/Loss of Associate Company |
1.55 |
-2.95 |
-4.75 |
-5.79 |
-7.84 |
|
NP after Minority Int & P/L Asso.Co. |
356.39 |
718.35 |
400.21 |
653.05 |
774.15 |
Balance Sheet as per rough estimates
|
|
FY13 |
FY14 |
FY15 |
FY16E |
FY17E |
|
SOURCES OF FUNDS: |
|
|
|
|
|
|
Share Capital |
62.52 |
62.52 |
62.52 |
62.52 |
62.52 |
|
Reserves & Surplus |
2488.64 |
3069.5 |
3312.77 |
3912.77 |
4612.77 |
|
Minority Interest |
355.48 |
396.34 |
441.02 |
483.15 |
525.92 |
|
Loan Funds |
2877.56 |
2895.89 |
1891.97 |
1571.97 |
1421.97 |
|
Deferred Tax Liability |
255.21 |
292.4 |
223.25 |
224.99 |
226.74 |
|
Other Liabilities |
16.59 |
20.32 |
24.08 |
28.259 |
32.47 |
|
Total Liabilities |
6056 |
6736.97 |
5955.61 |
6283.67 |
6882.39 |
|
APPLICATION OF FUNDS: |
|
|
|
|
|
|
Fixed Assets |
2914.55 |
3234.98 |
2945.97 |
3031.83 |
3078.96 |
|
Intangible Assets |
2.93 |
13.26 |
12.59 |
15.82 |
18.79 |
|
Investments |
580.66 |
783.55 |
868.61 |
896.58 |
1131.969 |
|
Current Assets, Loans & Advances |
3093.6 |
3715.26 |
3349.22 |
3393.08 |
3746.86 |
|
Inventories |
1784 |
2192.42 |
1915.75 |
1856.65 |
1922.52 |
|
Sundry Debtors |
746.48 |
867.85 |
809.51 |
870.98 |
973.17 |
|
Cash & Bank Balance |
64.98 |
80.75 |
202.76 |
178.94 |
205.05 |
|
Other Current Assets |
23.5 |
22.22 |
21.02 |
20.69 |
19.95 |
|
Loans & Advances |
474.64 |
552.02 |
400.18 |
465.83 |
626.16 |
|
Current Liabilities & Provisions |
732.72 |
1127.8 |
1422.81 |
1231.14 |
1274.21 |
|
Current Liabilities |
713.13 |
1031.08 |
1309.79 |
1113.56 |
1153.31 |
|
Provisions |
19.59 |
96.72 |
113.02 |
117.58 |
120.91 |
|
Net Current Assets |
2360.88 |
2587.46 |
1926.41 |
2161.94 |
2472.65 |
|
Other Assets |
196.98 |
117.72 |
202.03 |
177.29 |
179.82 |
|
Total Assets |
6056 |
6736.97 |
5955.61 |
6283.67 |
6882.39 |
Conclusion and Recommendation
We are positive on Vardhman Textiles Ltd (VTL) over the long term and hence recommend a BUY at CMP of RS.788.00 and further add on declines between Rs.740 to Rs.730 for a target of Rs.890 to Rs.960 with stop loss maintained at Rs.710.
- Share :


Post a Comment
|
DISCLAIMER |
This report is only for the information of our customers. Recommendations, opinions, or suggestions are given with the understanding that readers acting on this information assume all risks involved. The information provided herein is not to be construed as an offer to buy or sell securities of any kind. ATS and/or its group companies do not as assume any responsibility or liability resulting from the use of such information.