Uflex Ltd.
Uflex Ltd - Background
Uflex Ltd is engaged in manufacture and sale of flexible packaging products and flexible packaging solutions. The Company's products include printed, laminated, metalized, co-extruded, coated, embossed, plain plastic films and hologrammed sticker sheets. Its plastic film products include oriented polypropylene (OPP) films, polyester films, metalized and specialty films, and polyester chips. The Company's flexible packaging products include laminates, rotogravure cylinders, anilox/coating rollers, shims, holograms, and printing ink and adhesives, among others.
Uflex Ltd - Key Parameters
|
BSE Code |
500148 |
|
NSE Code |
UFLEX |
|
Reuters Code |
UFLX.Ns |
|
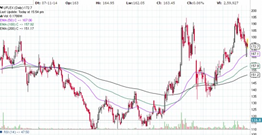
CMP (as on 10/11/2015) |
172.50 |
|
Stock Beta |
1.89 |
|
52 Week H/L |
197.50/110.00 |
|
Market Cap (Cr) |
1244.93 |
|
Equity Capital (Rs cr) |
72.21 |
|
Face Value (Rs) |
10 |
|
Average Volume |
569235 |
|
|
|
|
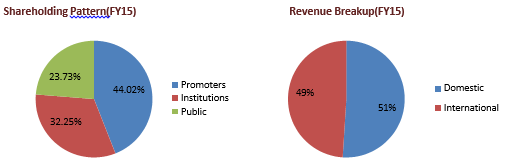
Shareholding Pattern (%) |
|
|
Promoters |
44.02 |
|
Others |
55.98 |
|
Grand Total |
100 |
Uflex Ltd - Investment Rationale
-
Make in India and GST
-
Favorable demographic pattern
-
Strong clientele and diversified usage
-
Aggressive Capex Plans
-
Low per capita consumption
Risks and Concerns
-
Competition from unorganized sector
-
Forex fluctuations
-
Varying manufacturing cost
Conclusion & Recommendation
Uflex Ltd being a dominant player in packaging industry with high quality products and wide market reach in both India and abroad. With the favorable market outlook and available market opportunities, we expect Uflex to perform considerable well in the medium term and long term
At the current market price of Rs.172.50 the stock is trading at 3x FY17E EPS. Investors could buy the stock at CMP and add on dips to around Rs.156 to Rs.158 levels (~2.5x FY17E EPS) for our sequential targets of Rs.210 and Rs.235 (~3.5 xs to ~4x FY17E EPS).
Uflex Ltd - Financial Summary
|
Particulars (Rs. in Crs) |
FY13 |
FY14 |
FY15 |
FY16E |
FY17E |
|
Net Sales |
4956.43 |
5710.6 |
6033.11 |
6455.43 |
7165.52 |
|
Operating Profit |
672 |
712.22 |
748.21 |
860.14 |
1027.92 |
|
PAT |
190.37 |
201.64 |
254.75 |
325.90 |
450.51 |
|
EPS (Rs.) |
26.36 |
27.92 |
35.28 |
45.13 |
62.39 |
|
PE |
6.54 |
6.18 |
4.89 |
3.82 |
2.76 |
Company Profile
Plastics film business
The main products of Uflex Ltd are OPP Films, Polyester Films, Metalized & Specialty films and Polyester Chips of different grades, etc. The Company’s OPP films comprising of BOPP and CPP films are highly cost-effective and functionally efficient and have rapidly penetrated into high barrier sensitive packaging segment across the World. It is primarily being used for applications in packaging food products such as tea, coffee, confectionery, biscuits, bakery, pasta, dried foods, meats and others. The technologically superior and highly dependable BOPP film can be structured in up to three layers and tailored for almost any machine requirements and is capable of meeting both Rotogravure and Flexography Printing standards. The Company produces BOPP film from its Indian plant which largely caters to the captive & domestic market and Egypt plant which caters to the international market. The CPP film is highly dynamic and versatile with high gloss, greater transparency, better heat sealability, good twisting property, and better tear strength. These factors provide its application in food wraps, anti wraps, anti-fog, garment bags, deep-freeze applications, etc. Presently CPP film too is produced from Indian plants and caters to captive consumption & the Indian market. The CPP plant in Egypt caters to the international market.
BOPET films in different ranges of microns have the capacity to sustain the high fidelity graphics and meet the requirements of both rotogravures as well as flexography printing standards besides having properties of BOPET film like optically brilliant, clear appearance, unequaled mechanical strengths, and toughness, excellent dielectric properties, good flatness and coefficient of friction (COF), tear-resistant and puncture-resistant characteristics wide range of thickness, excellent dimensional stability over a wide range of temperature, well resistant to most common solvents, moistures, oil and grease, an excellent barrier against a wide range of gases. BOPET film is produced in India, Dubai, Mexico, Poland, Egypt & USA. Indian plants meet captive & Indian market requirements whereas overseas plants serve overseas markets across the globe.
The Company has the facility to produce polyester chips of film grade, yarn grade, and bottle grade. The film grade chips are used as raw material for the manufacturing of polyester films whereas yarn grade chips are used for the manufacturing of polyester yarn and bottle grade chips for the production of PET bottles. The Company has made use of its state-of-the-art batch processing manufacturing facilities set up in India, by conveniently switching over to produce different grades of chips based on the demand and orders in hand. The Company manufactures a wide range of polyester chips suitable for various applications. Through continuous R&D efforts, the Company has developed different specialty polyester chips, which has been well accepted in the Indian and International market. Presently the Chip Unit also caters to the requirement of the Specialty Chips of the Company’s overseas Subsidiary Companies.
Flexible Packaging Business
The main products of this business are laminates made of various combinations of Polyester, BOPP, poly, metalized & hologram films and others in roll form and in various preformed pouches & bags of many sizes, rotogravure cylinders for various types of rotogravure printing, Anilox/Coating Rollers for flexo printing and Shims for holographic embossing and holograms and printing ink and adhesives and packaging & processing machines. This business involves customization according to the needs of customers The Company has the technical ability and innovative skills to design structures and barrier properties. The Company is one of the world leaders producing world-class flexible packaging solutions that:
-
Enhance market performance of the product
-
Improve utility for the end user
-
Help products reach out to new markets
-
Replace out-moded options with versatile and cost-effective solutions
Uflex Ltd offers finished packaging of a wide variety of products such as snack foods, candy and confectionery, sugar, rice & other cereals, beverages, tea & coffee, desert mixes, noodles, wheat flour, soaps and detergents, shampoos & conditioners, vegetable oil, spices,marinates & pastes, cheese & dairy products, frozen food, sea food, meat, anti-fog, pet food, pharmaceuticals, contraceptives, garden fertilizers and plant nutrients, motor oil and lubricants,
Cylinder division
The drive started manufacturing rotogravure Cylinders in the year 1986 and today boasts of a production capacity of over 35,000 cylinders per annum.
Chemical division
Chemical Division, provides complete flexible Packaging solutions to over 60 countries Uflex Chemical Division has established a US $ 6.5 million manufacturing facility at NOIDA (U.P) with ongoing technology transfer agreements with M/s. Color Converting Industries, U.S.A. and M/s. Sunkyong Industries Limited, South Korea-a Fortune 500 company. UFLEX Chemical Division also has an in-house Research Development laboratory, approved and recognized by the Department of Science and Technology, Government of India. This research facility is manned by a dedicated team comprising of some of the best scientific minds in the business.
Susidiary companies
-
Flex Middle East FZE, UAE
-
Flex Americas S.A. de C.V., Mexico
-
Flex P. Films (Egypt) S.A.E., Egypt
-
Flex Films Europa Sp. z o.o., Poland
-
UTech Developers Limited
-
Flex Films (USA) INC, USA
-
Uflex Packaging Inc., USA
-
Uflex Europe Limited, U.K.
-
UPET Holdings Ltd., Mauritius
-
UPET (Singapore) Pte. Ltd., Singapore
Investment Rationale
Make in India and GST
The Indian government is keen to provide a much more welcoming business environment for international investors than hitherto. The government’s ‘Make in India’ campaign is promoted with the aim of increasing manufacturing’s share of GDP from the current 15%, which is low for an emerging economy, to 25% by 2022. Foreign inward direct investment is clearly seen as an integral part of this strategy. Measures already introduced or planned include simplifying the tax system, simplifying investment procedures in the industry, including food processing, and most crucially devoting much greater resources to improving infrastructure, especially roads, rail, and energy, leading to reduced production and distribution costs. Government also plans to implement Goods and Service Tax (GST) in the foreseeable future can further fuel growth in the country. Implementation of GST and Make in India Campaign can trigger next level growth for the company.
Favorable demographic pattern
India is having a young population with vast majority of the population under the age bracket of 30 Years with fast increasing disposable income and increasing appetite for cosmetics and packed food and beverages will help the company to increase the revenue. Currently barely 5% of food in India reaches the consumer in pre-packaged form. As a result of poor distribution infrastructure, nearly 40% of fresh food in India is estimated to perish before reaching the consumer, resulting in lost income for small farmers and higher prices for consumers. And the increase in brand consciousness and quality awareness among the people presents huge opportunities for rapid flexible packaging growth.
Strong clientele and diversified usage
Uflex Ltd clients include major players in FMCG and food and beverages such as HUL, Brittania, Nestle, Cadbury, P&G, Dabur, Colgate, Godrej Consumer, Castrol, Henkel, ITC, Pepsi, Coca Cola, Parle, Haldiram, Perfetti, 3‐M, Wrigley, Tata Tea, GSK Consumer and many more. The majority of the clients have been buying products from Uflex for a long period of time and have contracts running for a considerable amount of time, which acts as a queasy partner to the company. With the growth prospects of FMCG and food and beverages looking bright the growth of the client companies will further add to the growth prospects of the company. The company provides packaging solutions for processed food (e.g. biscuits, snacks, confectionery, spices, wheat flour, rice, pulses, etc.), personal products (e.g. shampoo, soaps, detergents, hair dye, etc.), beverages (e.g. tea, coffee, milk products, and baby food, etc.). Which will reduce the risk of the company ie a decrease in demand for a particular product category can be hedged by an increase in demand for another product category.
Low per capita consumption
The per capita consumption of packaging in India is merely 4.3 kg per person per annum. By comparison, Germany is at 42 kg and Taiwan at 20 kg, the challenges that the industry is facing today include lack of regulatory clarity in packaging, insufficient consumer awareness of sustainable packaging, and uncertainty about green packaging materials. In the Indian packaging industry, processed food packaging represents 48% of the total, personal care packaging is 27%, pharma is 6%, and the rest is 19%. In developed nations, the growth of the flexible packaging sector is estimated to be growing at a rate of about 2.5 – 3.5% whereas, in developing countries, this growth is in the range of 8-12% annually. India in fact, historically is growing at 15-18% p.a. With the increase in demand for the products in food, pharma, cosmetics, etc will bring parity in the per capita consumption of packaging, and Uflex being a major player in the industry will benefit from the growth in the industry.
Aggressive Capex Plans
Uflex Ltd has capex plans Rs 580 crore in the first phase of setting up their new plant at Sanand near the city. As part of their expansion plans to foray into the liquid packaging segment, the company has acquired 72 acres of land in the Sanand industrial area to set up the 'Aseptic Packaging Plant' to manufacture packaging material for liquid products, such as milk, juices and energy drinks. The project is proposed to be commissioned and fully operational by April 2017 Later on, we intend to add some more facilities here in phase wise manner with a total investment of Rs 1,500 crore. The capacity in the initial phase would be around 3.5 billion packs; it would be increased up to seven billion packs over time. Companies India centric capex plans provides very good opportunity to capitalize on the growth opportunity available in domestic market.
Global reach
The company has strong global presence and operates in India, the UAE, Mexico, Egypt, Poland, the US, the UK, Mauritius and Singapore and and mainly sells BOPET, BOPP,CPP, coated films, laminates, pouches, holographic films gravure cylinders, inks and adhesives I more than 135 countries. Rapid increase in propagation of polymer based technology products and innovation in flexibility of the product makes in compatible for new demands in industry mainly in developing countries were the demand for the packaging products are growing in a fast pace when compared to developed countries provides growth opportunities to the company
Sound financials and consistent growth
The net revenue of the company is growing steady at ~11.5 CAGR from FY11 and the debt of the company stood at Rs.1812 crore. The company has a reserve of Rs.2935 crore, which used for its capital expenditures and modernization plans. Uflex plans to reduce its debt in the coming years and have a debt repayment calendar in schedule.
Industry Profile
Over the last decade or so, the Indian FMCG sector has been highly pro-active in expanding the market with a greater range of product categories and much deeper penetration of the urban and rural markets. Not to be left behind, the packaging industry has kept pace with the growth and demands of the brand owners in the FMCG sector through technology enhancement, investments and capacity expansion. Several global packaging companies are now present in India. All in all, it has been a decade of rapid growth for the Indian packaging industry and the coming decade promises to be equally good, though the recent economic slowdown may show up a trough or two in the charts.
Flexible packaging market in India has grown rapidly over the last three decades and now accounts for 29% of the consumer packaging market. Better packaging economics compared to other packaging media, product features, and technology developments in high-barrier films, multi-colour printing and high speed filling lines are some of the factors that have aided flexible packaging in gaining a significant share of the consumer packaging market.
The per-capita consumption of packaged beverages and food in India is still very low compared to other regions. However, expenditure on these products has doubled in the last five years. Within the next five years it will increase by another 14 per cent annually, as the demand for processed food is rising due to growing disposable incomes, urbanization, and a young population. Keep an eye on the Indian foodservice industry, too. Currently it’s estimated to be nearly $13.79 billion. But it’s growing at a healthy compound annual growth rate (CAGR) of 17 per cent, which has significant implications for the packaging sector. Plans are currently in place, thanks to public and private funding, to establish 30 to 40 mega food parks. Corresponding infrastructure for packing, packaging transport, and refrigeration are part of these plans, so this development is expected to give food manufacturing—and, by extension, packaging—a big boost. In fact, by 2015 more than $25 billion is to be pumped into the food sector and the required infrastructure.
The per capita consumption of packaging in India is merely 4.3 kg per person per annum. By comparison, Germany is at 42 kg and Taiwan at 20 kg, the challenges that the industry is facing today include lack of regulatory clarity in packaging, insufficient consumer awareness of sustainable packaging, and uncertainty about green packaging materials. In the Indian packaging industry, processed food packaging represents 48% of the total, personal care packaging is 27%, pharma is 6%, and the rest is 19%. The Indian Ready-to-Eat food market is estimated to grow to $727.09 million by 2015 from the current level of $32.09 million. The food packaging sector grows in tandem with food processing, which is surging at 6-7%.The increasing awareness regarding clean water, safe food, and pharmaceuticals will drive this growth. As the retail sector grows, the concept of track and trace devices, especially for product identification such as 2D barcodes, radio frequency identification (RFID), etc. will penetrate aggressively into Indian packaging.”
Packaging has an annual global turnover of about $550 billion, and India’s share is about $16.5 billion per annum. According to a recent Mckinsey report, there will be a ten-fold increase in India’s middle-class population by 2025, which will further trigger the consumption of packaging materials. This will bring another growth spurt to packaging, says the Mckinsey report, which also notes that the country needs more packaging professionals. According to the Packaging Industry Association of India (PIAI), packaging in India is one of the fastest-growing sectors, partly because it spans almost every industry segment. Right from packaging of food and beverages, fruits and vegetables, drugs and medicines, to highly dangerous products, packaging has led to greater specialization and sophistication over a period of years.
At present, the Indian Packaging Industry is ranked 11th in the world, and industry experts are of the opinion that packaging in India is expected to grow to $16.5 billion by 2015. However, according to a report conducted by the New Delhi-based Centre for Market Research & Social Development, packaging in India is highly fragmented and has 22,000 firms, including raw material manufacturers, machinery suppliers, and providers of ancillary materials and services. Moreover, 85% of these firms are Micro, Small & Medium Enterprises (MSMEs). As the industry grows and matures, there is expected to be a trend towards consolidation as supply-side companies merge and acquire smaller companies to increase scale, reduce competition, and improve bargaining power with customers, the report said. The shift from traditional rigid packaging to flexible packaging on account of its attractiveness, cost effectiveness, and strength is largely aided by increasing consumer demand for processed food.
The future of the Indian packaging industry is very good, if investment materializes. The growth of the domestic market will be good and export potential is substantial, too, if it’s properly addressed. If organized retail takes off as expected, growth opportunities are substantial, and enormous potential exists in converting wasted food into valuable product. To maximize the potential that packaging represents, the Indian government is in consultation with a number of industry experts. For example, PIAI is formulating effective policies and guidelines aimed at helping Indian companies gain in the international market. The Indian packaging industry is expected to grow at 12.3% CAGR during next 4-5 years to become the fourth largest global market, with sales of $42.7 billion.”
The packaging market in India seems set for the next level of growth. Strong favorable demographic factors such as increasing disposable income levels and rising consumer awareness and demand for processed food are helpful. So is the rise of the Indian middle class, which is expected to go from today’s 50 million to 583 million in 2025. Also important is that the world’s multinational giants are taking rapid strides in India’s food, beverage, health and beauty, and pharmaceuticals sectors. This will also drive growth in packaging. These factors are forcing both packaging suppliers and end users to shift from bulk packaging to retail, unit-level, small-sized packaging. In addition, exploding organized retail growth and newly relaxed investment norms in retail and other sectors augur well for the packaging market in India.
Risks and Concerns
Competition from unorganized sector
There are large number unorganized players in packaging market delivering products at different standards. Uflex being a dominant player is exposed to high completion from these players both in domestic and international markets.
Changes in manufacturing cost
Ufles main raw material is crude oil derivatives, so the company’s profit margins are exposed to the price fluctuations in the crude oil and its derivatives.
Forex fluctuations
As considerable amount of the company’s total revenue comes from export to different counties, uflex is exposed to changes in the currency exchange rates. As it can make huge impact on the company’s overall revenue and margins.
Financials
Quarterly results overview
-
Consolidated net profit stood at Rs.77.74 crore for the second quarter ended September 30.
-
Total income on consolidated basis was down 8.10 percent to Rs 1,524.87 crore during the quarter as against Rs.1,659.38 crore in the year-ago period.
-
Consolidated net profit for the first half of FY 2015-16 was up 19.18 percent to Rs.153.92 crore as against a net profit of Rs.129.14 crore in the same period a year ago.
-
Total income during the first half of the current fiscal was down 2 percent to Rs.3,125.50 crore as against Rs.3,189.48 crore in the same period a year ago.
QoQ Analysis
|
|
2ndQtr201509 |
2nd Qtr201409 |
VAR % |
2ndQtr201509 |
1stQtr201506 |
VAR % |
|
Gross Sales |
1492.11 |
1610.2 |
-7.3 |
1492.11 |
1569.83 |
-5.0 |
|
Excise Duty |
0 |
0 |
0 |
0 |
0 |
0 |
|
Net Sales |
1492.11 |
1610.2 |
-7.3 |
1492.11 |
1569.83 |
-5.0 |
|
Other Operating Income |
32.76 |
49.18 |
-33.4 |
32.76 |
30.8 |
6.4 |
|
Other Income |
10.17 |
4.12 |
146.8 |
10.17 |
3.62 |
180.9 |
|
Total Income |
1535.04 |
1663.5 |
-7.7 |
1535.04 |
1604.25 |
-4.3 |
|
Total Expenditure |
1314.78 |
1461.01 |
-10 |
1314.78 |
1385.69 |
-5.1 |
|
PBIDT |
220.26 |
202.49 |
8.8 |
220.26 |
218.56 |
0.8 |
|
Interest |
44.69 |
52.54 |
-14.9 |
44.69 |
46.78 |
-4.5 |
|
PBDT |
175.57 |
149.95 |
17.1 |
175.57 |
171.78 |
2.2 |
|
Depreciation |
71.43 |
70.67 |
1.1 |
71.43 |
70.77 |
0.9 |
|
Minority Interest Before NP |
0 |
0 |
0 |
0 |
0 |
0 |
|
PBT |
104.14 |
79.28 |
31.4 |
104.14 |
101.01 |
3.1% |
|
Tax |
25.53 |
14.97 |
70.5 |
25.53 |
25.41 |
0.5 |
|
Reported Profit After Tax |
78.61 |
64.31 |
22.2 |
78.61 |
75.6 |
4 |
|
Minority Interest After NP |
1.19 |
0.22 |
440.9 |
1.19 |
0.2 |
495 |
|
Profit/Loss of Associate Company |
0.32 |
1.02 |
-68.6 |
0.32 |
0.78 |
-59 |
|
NP after Minority Int & P/L Asso.Co. |
77.74 |
65.11 |
19.4 |
77.74 |
76.18 |
2 |
|
Extra-ordinary Items |
0 |
0 |
0 |
0 |
0 |
0 |
|
Adj Profit After Extra-ord item |
77.74 |
65.11 |
19.4 |
77.74 |
76.18 |
2 |
Profit and Loss Account as per rough estimates
|
|
FY13 |
FY14 |
FY15 |
FY16E |
FY17E |
|
Gross Sales |
4956.43 |
5710.6 |
6033.11 |
6455.43 |
7165.52 |
|
Excise Duty |
0 |
0 |
0 |
0.00 |
0.00 |
|
Net Sales |
4956.43 |
5710.6 |
6033.11 |
6455.43 |
7165.52 |
|
Other Income |
19.08 |
28.63 |
16.61 |
20.67 |
22.03 |
|
Other Operating Income |
204.65 |
152.65 |
147.23 |
140.38 |
154.73 |
|
Total Income |
5180.16 |
5891.88 |
6196.95 |
6616.48 |
7342.28 |
|
Total Expenditure |
4508.16 |
5179.66 |
5448.74 |
5756.34 |
6314.36 |
|
PBIDT |
672 |
712.22 |
748.21 |
860.14 |
1027.92 |
|
Interest |
229.64 |
233.27 |
186.91 |
194.21 |
188.66 |
|
PBDT |
442.36 |
478.95 |
561.3 |
665.93 |
839.26 |
|
Depreciation |
235.99 |
267.08 |
279.4 |
308.00 |
344.11 |
|
PBT |
206.37 |
211.87 |
281.9 |
357.93 |
495.15 |
|
Tax |
18.63 |
15.12 |
30.86 |
35.79 |
49.51 |
|
Reported Profit After Tax |
187.74 |
196.75 |
251.04 |
322.14 |
445.63 |
|
Minority Interest After NP |
0 |
-0.01 |
0.74 |
1.05 |
1.21 |
|
Profit/Loss of Associate Company |
2.63 |
4.88 |
4.45 |
2.71 |
3.67 |
|
Net Profit after Minority Int & P/L Asso.Co. |
190.37 |
201.64 |
254.75 |
325.90 |
450.51 |
|
Extra-ordinary Items |
0 |
0 |
0 |
0 |
0 |
|
Adjusted Profit After Extra-ordinary item |
190.37 |
201.64 |
254.75 |
325.90 |
450.51 |
Balance Sheet (as per rough estimates)
|
|
FY13 |
FY14 |
FY15 |
FY16E |
FY17E |
|
SOURCES OF FUNDS: |
|
|
|
|
|
|
Share Capital |
72.21 |
72.21 |
72.21 |
72.21 |
72.21 |
|
Reserves & Surplus |
2426.39 |
2750.69 |
2935.48 |
3009.19 |
3124.60 |
|
Minority Interest |
0 |
0.01 |
0.75 |
0.313 |
0.318 |
|
Loan Funds |
1812.9 |
1923.93 |
1812.7 |
1849.64 |
1886.59 |
|
Deferred Tax Liability |
171.99 |
141.18 |
120.07 |
121.14 |
105.43 |
|
Other Liabilities |
12.47 |
13 |
13.99 |
17.1 |
18.04 |
|
Total Liabilities |
4495.96 |
4901.02 |
4955.2 |
5069.60 |
5207.39 |
|
APPLICATION OF FUNDS: |
|
|
|
|
|
|
Fixed Assets |
3377.5 |
3452.2 |
3272.24 |
3422.24 |
3622.24 |
|
Intangible Assets |
0 |
0 |
0.03 |
0 |
0 |
|
Investments |
101.88 |
125.86 |
138.03 |
150.45 |
165.50 |
|
Current Assets, Loans & Advances |
2351.83 |
2844.66 |
2893.96 |
2734.50 |
2962.94 |
|
Inventories |
470.2 |
610.74 |
660.97 |
738.80 |
823.20 |
|
Sundry Debtors |
1276.03 |
1505.18 |
1508.71 |
1209.84 |
1299.07 |
|
Cash & Bank Balance |
162.22 |
207.42 |
192.19 |
201.64 |
215.437 |
|
Other Current Assets |
21.17 |
15.61 |
1.52 |
10.92 |
12.48 |
|
Loans & Advances |
422.21 |
505.71 |
530.57 |
573.299 |
612.76 |
|
Current Liabilities & Provisions |
1468.25 |
1693.57 |
1512.74 |
1412.53 |
1709.65 |
|
Current Liabilities |
1403.43 |
1625.42 |
1450.22 |
1365.73 |
1665.41 |
|
Provisions |
64.82 |
68.15 |
62.52 |
46.80 |
44.24 |
|
Net Current Assets |
883.58 |
1151.09 |
1381.22 |
1321.97 |
1253.29 |
|
Other Assets |
133 |
171.87 |
163.68 |
174.94 |
166.36 |
|
Total Assets |
4495.96 |
4901.02 |
4955.2 |
5069.60 |
5207.39 |
Conclusion and Recommendation
We are positive on Uflex over the long term and hence recommend a BUY at CMP of RS.172.50 and further add on declines between Rs.156 to Rs.158 for a target of Rs.210 to Rs.235 with stop loss maintained at Rs.140.
- Share :


Post a Comment
|
DISCLAIMER |
This report is only for the information of our customers. Recommendations, opinions, or suggestions are given with the understanding that readers acting on this information assume all risks involved. The information provided herein is not to be construed as an offer to buy or sell securities of any kind. ATS and/or its group companies do not as assume any responsibility or liability resulting from the use of such information.