Trident
Trident Limited - Background
Trident Limited (Trident) is the flagship company of Trident Group, a USD 1 billion Indian business conglomerate and a global player. Trident Limited is an India-based terry towel, yarn and wheat straw based paper manufacturer. The Company operates through segments, including textiles, paper and chemic and others. The Company has manufacturing facilities in Punjab and Madhya Pradesh. The textiles segment includes yarn, towel, dyed yarn manufacturing, including utility service. The paper and chemical segment includes paper and sulfuric acid, including utility service. The others segment includes sale of software and related services. Its product portfolio includes towels, bed-linen and yarn.. It offers printed bed-linen, organic bed-linen and air rich bed-linen. It also offers melange, core spun yarn, slub yarn and core spun slub yarn, among others. It offers writing and printing paper, branded copier paper, Maplitho and Bible and offset printing paper.
Trident Limited - Key Parameters
|
BSE Code |
521064 |
|
NSE Code |
TRIDENT |
|
Reuters Code |
TRIE.NS |
|
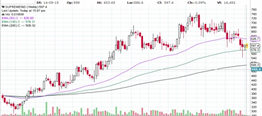
CMP (as on 06/10/2015) |
41.20 |
|
Stock Beta |
0.92 |
|
52 Week H/L |
745/540 |
|
Market Cap (Cr) |
2096.45 |
|
Equity Capital (Rs cr) |
508.64 |
|
Face Value (Rs) |
10 |
|
Average Volume |
1162892 |
|
|
|
|
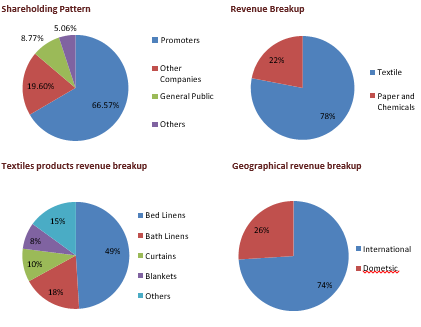
Shareholding Pattern (%) |
|
|
Promoters |
66.57 |
|
Non Institutions |
33.43 |
|
Grand Total |
100 |
Trident Limited - Investment Rationale
-
Significant market share and strong clientele
-
Aggressive capex plans
-
Efficiency in operations
-
Consistent growth
-
Opportunities in domestic market
Risks and Concerns
-
Competition from unorganized sector
-
Growth of client companies
-
Cost fluctuations
Conclusion & Recommendation
Trident Limited being a dominant player in domestic and international housing textiles and paper market with its high quality products and wise market reach in both India and abroad. With aggressive capex plans, and growth opportunities we expect company to outperform the industry in the both medium term and long term future.
At the current market price of Rs.41.20 the stock is trading at ~8x FY17E EPS. Investors could buy the stock at CMP and add on dips to around Rs.35 to Rs.37 levels (~7x FY17E EPS) for our sequential targets of Rs.48 and Rs.52 (~9x to ~10x FY17E EPS).
Financial Summary
|
Particulars (Rs. in Crs) |
FY2013 |
FY2014 |
FY2015 |
2016E |
2017E |
|
Net Sales |
3335.18 |
3868.96 |
3755.33 |
4361.55 |
5146.63 |
|
Operating Profit |
577.77 |
743.92 |
695.24 |
840.50 |
990.15 |
|
PAT |
48.56 |
197.27 |
117.44 |
161.66 |
265.69 |
|
EPS (Rs.) |
0.95 |
3.88 |
231 |
3.18 |
5.22 |
|
PE (x) |
42.10 |
10.36 |
17.41 |
12.65 |
7.70 |
Business Profile
Home textiles
Trident Limited with its consistent investment in technology, constant research and an innovative approach, it has acquired wide and varied global scale capabilities in terry towel production. From a variety of fibres and yarns to a range of colours, both in piece dyed and yarn dyed, plains & jacquards, to a complete collection of performance finishes and surface decorations, our range keeps expanding to meet the unique needs of our customers. Trident is focused on continuous innovation, be it the production infrastructure, fibre use, yarn production & processing. From the finest yarns to special fibres like bamboo, eucalyptus, ramie, soya, milk etc to new weaving techniques, Trident has been giving new products to the market on a regular basis. Innovations like the Air Rich and Zero twist have redefined the way the world looks at luxury towels. The other exciting offerings include Low Twist, Quick Dry Towel, Luxury Towels, Pro Collection Towels - value added surface finish collection comprising Bleach Pro, Color Pro, Health Pro, White Pro and Fresh Pro.
Paper
Trident Ltd is one of the preferred chemical manufacturers and suppliers of high quality paper for multi-colour high speed printing and publishing and high quality branded copier paper. With a clearly defined customer centric approach, it have achieved a reputation of being one of the prominent chemical & paper manufacturing companies in the domestic and international markets. Trident Paper is an ISO 9001:2000 & OHSAS 18001 certified mills with an Integrated Pulp and Paper mill using mainly Wheat Straw (agro-residue) as the primary raw material, to produce Eco-friendly high quality branded Copier paper along with Surface Size & NSS, Printing & Writing Paper varieties. The zeal of continuous improvement and excellence to satisfy customer's need is committed with production of new varieties: Diamond Line SS Maplitho, Cartridge paper, Natural shade paper with 92% brightness.
Capex plans
|
Business |
Operations |
||
|
Divison |
Product |
Existing |
Post ongoing expansions |
|
Textiles |
Terrry towels |
688 Looms |
688 Looms |
|
Bed Lenin |
--- |
500 Looms |
|
|
Yarn |
3.66 Lac Spindles |
5.50 Lac Spindles |
|
|
5,500 Rotors |
5,500 Rotors |
||
|
Paper & Chemicals |
Dyed Yarn |
6825 TPA |
6826 TPA |
|
Paper |
175000 TPA |
200000 TPA |
|
|
Chemicals |
100000 TPA |
100000 TPA |
|
|
Energy |
Captive Power |
50 MW |
50 MW |
Investment Rationales
Significant market share and Strong clientele
Trident is World's largest manufacturer of terry towels, one of the largest manufacturer of wheat straw based paper. It have a presence for home textiles products with product availability across 1,200 retail stores, 120 multi-branded outlets, all major e-selling portals and major TV-commerce channels. The products are sold in more than 75 countries spread across six counties, which includes US, Japan, UK, Italy, France, Japan, Australia, South Africa, Canada, Europe and fast growing European and North American counties. 15-20% increase in price of cotton and increase in manufacturing expenses in Pakistan and China will act as a supplement in growth prospects of the company. The Company has a strong client list comprising global retail and institutional brands like JC Penney, Wal-Mart Stores Inc., Ralph Lauren, Calvin Klein, Carrefour S.A., H&M, IKEA, Marks & Spencer, ITC Hotels, Taj Hotels Resorts and Palaces, Oberoi Hotels & Resorts, among others.
Aggressive capex plans
Trident Limited at an investment of USD 250 million to set up an integrated bed sheeting project of 500 air jet looms at Budni. This will enable the Company to deliver about 120,000 metres of bed sheeting fabric (equivalent to 17,500 sheet sets) per day. The bed sheet unit will be backed by a spinning unit of 1.90 lac spindles to make the sheeting plant a vertically-integrated, self-reliant facility capable of manufacturing top- quality bed sheeting products. The project is expected to be commissioned in the second half of FY16. The new facility has not only enabled the Company to deliver all kinds of towels from a single facility, but will also help the Company deliver a higher output and achieve qualitative consistency. Currently, Trident Ltd has a capacity of 688 terry towel looms and 3.66 lac yarn spindles. Post-expansion of its upcoming integrated bed linen unit of 500 looms and 1.90 lac yarn spindles, the total yarn spindles will become 5.55 lac. The technology is expected to be stabilized by Q4 of FY16. The company is expected to achieve 50-60% utilization by FY17. The Company has installed air jet looms, continuous dyeing and processing as well as fully-automatised cutting, stitching and packing machines in this facility thereby upping the level of satisfaction for the customers. The CAPEX which we are implementing is Rs. 1,667 crore which is for the composite sheeting project and already on an overall basis around Rs. 1,000 crore have spent FY16. These capex plans will help the company to increase the share value added products in yarn and paper segment in the overall revenue of the company, which will increase the bottom line.
Efficiency in operations
Trident Limited has partnered with trusted global textile technology brands like Karl Mayer, Toyota, Staubli, Benninger, Rieter, Muratec, LMW, Trutzschler, Saurer, Savio and Uster while investing in expansion and diversification, which will help the company in manufacturing to the minimum and it will add to the cost advantage for the company over its competitors. Various cost optimisation measures like Kaizen, TQM and TPM ensured enhanced production and utilization. India being the second largest producer of cotton in the world helps the company to easily procure high-quality cotton at cost competent prices. The new facilities of the company have not only enabled the Trident Ltd to deliver all kinds of towels from a single facility but will also help the Company deliver higher output and achieve qualitative consistency. The in-house power plant of 50MW will further reduce the power expenses of the company.
Consistent growth
Trident Limited have a CAGR of over 30%, one of the fastest growing group of companies in the country, 27% CAGR for inception, 38% CAGR in exports and PBT. It has a improved proportion of terry towel in overall textiles from 47% in FY14 to 56% in FY15. The Budhni unit is steadily scaling up and currently operating at 40% utilization level and is expected to reach 55-60% by the end of this financial year. The textile segment, we have moved from being 60% yarn player and 40% towel player two years ago to about 60% terry towel and 40% yarn in FY15 and over the next 2-3 years, we should see high margin Bath and Bed Linen products contributing over 80% to textile revenues. This should lead to healthy top-line and strong bottom-line growth over the next 2-3 years. There is an increase in terry towel volumes by 17% as compared to the previous year and Copier paper contributed ~50% to total paper revenues. Trident Ltd is the world’s largest wheat straw-based paper producer with a paper and pulp capacity of 175,000 tonnes per annum and 125,000 tonnes per annum respectively, which is having a higher margin than the textiles segment with companies plans to increase in the volume of value-added products, will help the company to increase the topline margins.
Opportunities in domestic market
Trident Limited is well-positioned to capture the increasing domestic demand. The Company has its own brands in the domestic market like Trident Classic, Trident Home Essential, Trident every day, Trident His & Her, Trident Indulgence, Trident Organica, Trident Play, Trident Bath Buddy, and Trident Cuddlies, catering to a diverse set of customers from couples, to sports persons to infants. Other exciting offerings include Low Twist, Quick Dry Towel, Luxury Towels, Pro Collection Towels - value-added surface finish collection comprising Bleach Pro, Color Pro, Health Pro, White Pro, and Fresh Pro. To make deeper penetration in the domestic market, and the Company is selling its own brands through renowned e-commerce websites in India. This will provide the Company with a competitive advantage of having an established brand name and a pan- India network. The favorable demographic pattern with high per capita income, higher per capita expenditure on branded and high-quality products, will act as a supplement to the growth of the company.
Industry Overview
Textiles sector is one of the largest contributors to India’s exports with approximately 11 per cent of total exports. The textiles industry is also labour intensive and is one of the largest employers. The industry realised export earnings worth US$ 41.4 billion in 2014-15, a growth of 5.4 per cent, as per The Cotton Textiles Export Promotion Council (Texprocil). The textile industry has two broad segments. First, the unorganised sector consists of handloom, handicrafts and sericulture, which are operated on a small scale and through traditional tools and methods. The second is the organised sector consisting of spinning, apparel and garments segment which apply modern machinery and techniques such as economies of scale.
The Indian textiles industry is extremely varied, with the hand-spun and hand-woven textiles sectors at one end of the spectrum, while the capital intensive sophisticated mills sector at the other end of the spectrum. The decentralised power looms/ hosiery and knitting sector form the largest component of the textiles sector. The close linkage of the textile industry to agriculture (for raw materials such as cotton) and the ancient culture and traditions of the country in terms of textiles make the Indian textiles sector unique in comparison to the industries of other countries. The Indian textile industry has the capacity to produce a wide variety of products suitable to different market segments, both within India and across the world.
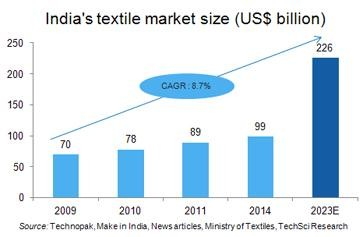
Market Size
The Indian textiles industry, currently estimated at around US$ 108 billion, is expected to reach US$ 223 billion by 2021. The industry is the second largest employer after agriculture, providing employment to over 45 million people directly and 60 million people indirectly. The Indian Textile Industry contributes approximately 5 percent to India’s gross domestic product (GDP), and 14 percent to the overall Index of Industrial Production (IIP).
The Indian textile industry has the potential to reach US$ 500 billion in size according to a study by Wazir Advisors and PCI Xylenes & Polyester. The growth implies domestic sales to rise to US$ 315 billion from currently US$ 68 billion. At the same time, exports are implied to increase to US$ 185 billion from approximately US$ 41 billion currently.
Textile Industry Going Forward
The new textile policy of Indian Government has an ambitious target of achieving 20 per cent share of the global textile trade and helping the domestic industry attain a size of $650 billion by 2024-25 by focusing on investments, skill development and labour law reforms. The policy blueprint, termed as the ‘Vision, Strategy and Action Plan’ for the textiles and apparel industry, lays thrust upon diversification of exports through new products and markets along with increasing value addition and promoting innovation and R&D activities.
The industry is expected to attract investment of about $120 billion by 2024-25 and create about 35 million additional jobs in the process. Exports are also expected to rise from the current $39 billion to $300 billion by 2024-25. The action plan notes that attracting the required investment entails ready availability of developed land with adequate infrastructure, skilled manpower and easy connectivity to ports, along with creation of new mega textile parks, lowering the cost of production and logistics, encouraging new entrants through start-ups, as well as FDI. With the textile industry growth, the textile machinery industry size is also expected to double to Rs. 45,000 crores in the next seven years from the present Rs. 22,000 crores on the back of new projects and emphasis on setting up textile parks.
The chemical industry in India is a key constituent of Indian economy, accounting for about 2.11 per cent of the gross domestic product (GDP). In terms of volume of production, Indian chemical industry is the third largest producer in Asia and sixth largest in the world. Indian chemical industry generated business worth US$ 118 billion in 2014. Bulk chemicals account for 39 per cent of the Indian chemical industry, followed by agrochemicals (20.3 per cent) and specialty chemicals (19.5 per cent). Pharmaceuticals and biotechnology accounted for the remaining share.
India’s growing per capita consumption and demand for agriculture-related chemicals offers huge scope of growth for the sector in the future. Lured by the size and returns of the Indian market, foreign firms have strengthened their presence in India. From April 2000 to May 2015, total foreign direct investment (FDI) inflows into the Indian chemicals industry (excluding fertilisers) were US$ 10.49 billion. The Government of India has been supportive to the sector. 100 per cent FDI is permissible in the Indian chemicals sector while manufacturing of most chemical products is de-licensed. The government has also been encouraging Research and Development (R&D) in the sector. Moreover, the government is continuously reducing the list of reserved chemical items for production in the small-scale sector, thereby facilitating greater investment in technology up-gradation and modernisation.
Peer Group Comparison
|
Sl. No. |
Name |
CMP Rs. |
P/E |
MC in Rs. Cr |
DY% |
CMP/BV |
|
1 |
3,615.15 |
19 |
33,212.38 |
0.5 |
1.41 |
|
|
2 |
Welspun India |
892.95 |
15 |
8,970.58 |
1.18 |
5.62 |
|
3 |
916.45 |
14.55 |
5,833.20 |
1.09 |
1.81 |
|
|
4 |
281 |
21.2 |
7,256.54 |
0.91 |
2.89 |
|
|
5 |
1,183.25 |
21.65 |
6,794.22 |
0.85 |
2.75 |
|
|
6 |
920.95 |
19.43 |
3,635.91 |
0 |
9.94 |
|
|
7 |
811.35 |
19.77 |
3,057.17 |
1.11 |
3.38 |
|
|
8 |
41.7 |
14.48 |
2,121.90 |
1.35 |
1.4 |
Risks and Concerns
Competition from unorganized sector
There are large number unorganized players in yarn, textiles, and paper products at different standards. Trident Ltd is exposed to high completion from these players both in domestic and international markets.
Growth of the client companies
Majority of the Tridents revenue comes from client companies in both domestic and international market, so the decline in demand for the client companies products will have a negative impact on the company.
Cost fluctuations
Cost of raw materials contributes a significant share in the cost of production for Trident products and rupee depreciation would increase cost of imports, which in turn, could affect profitability.
Financials
Quarterly financial review
-
Net Revenue at Rs. 879.1 crore compared to Rs. 913.3 crore in Q1 FY15. Net Sales declined due to lower yarn realizations and higher captive consumption of yarn. De-growth from yarn mitigated by increased product off-take in the Terry Towel
-
EBITDA increased by 7.6% to Rs. 198.0 crore from Rs. 184.0 crore in Q1 FY15. EBIDTA Margin improved by 237 bps to 22.5% vis-à- vis 19.9% in Q4 FY15
-
Finance Cost declined by 23.5% to Rs. 44.5 crore vis-à-vis Rs. 58.1 crore in Q1 FY15. Improvement in credit rating has enabled the Company to significantly reduce the overall interest costs. The Company repaid term loan amounting to Rs. 102.9 crore during the quarter. Outstanding term debt as on June 30, 2015 stood at Rs. 1,896.5 crore
-
PAT increased by 89% to Rs. 61.0 crore vis-à-vis Rs. 32.3 crore in Q1 FY15. Diluted EPS (non-annualized) at Rs. 1.20 per share
-
Cash Profits at Rs. 142.3 crore vis-à-vis Rs. 113.1 crore in Q1 FY15. Cash EPS (diluted & non-annualized) at Rs. 2.80 per share
Q1FY16
|
|
1st Qtr201506 |
1st Qtr201406 |
VAR [%] |
1st Qtr201506 |
4th Qtr201503 |
VAR [%] |
|
Net Sales |
873.88 |
900.43 |
-2.9 |
873.88 |
965.96 |
-10.5 |
|
Other Operating Income |
5.21 |
12.83 |
-59.4 |
5.21 |
12.06 |
-131.5 |
|
Other Income |
1.72 |
1.59 |
8.2 |
1.72 |
0.07 |
95.9 |
|
Total Income |
880.81 |
914.85 |
-3.7 |
880.81 |
978.09 |
-11.0 |
|
Total Expenditure |
682.83 |
730.82 |
-6.6 |
682.83 |
783.05 |
-14.7 |
|
PBIDT |
197.97 |
184.03 |
7.6 |
197.97 |
195.04 |
1.5 |
|
Interest |
44.46 |
58.14 |
-23.5 |
44.46 |
53.63 |
-20.6 |
|
PBDT |
153.51 |
125.89 |
21.9 |
153.51 |
141.41 |
7.9 |
|
Depreciation |
81.36 |
80.85 |
0.6 |
81.36 |
82.94 |
-1.9 |
|
PBT |
72.15 |
45.04 |
60.2 |
72.15 |
58.48 |
18.9 |
|
Tax |
0 |
12.75 |
0 |
0 |
0 |
0.0 |
|
Deferred Tax |
11.18 |
0 |
0 |
11.18 |
18.06 |
-61.5 |
|
Reported Profit After Tax |
60.97 |
32.29 |
88.8 |
60.97 |
40.42 |
33.7 |
|
Extra-ordinary Items |
0 |
0 |
0 |
0 |
0 |
0.0 |
|
Adj Pro After Extra-ordinary item |
60.97 |
32.29 |
88.8 |
60.97 |
40.42 |
33.7 |
|
|
|
|
|
|
|
|
|
PBIDTM(%) |
22.65 |
20.44 |
10.8 |
22.65 |
20.19 |
10.9 |
|
PBDTM(%) |
17.57 |
13.98 |
25.7 |
17.57 |
14.64 |
16.9 |
|
PATM(%) |
6.98 |
3.59 |
94.4 |
6.98 |
4.18 |
40.1 |
Profit and Loss Account as per rough estimates
|
|
2013 |
2014 |
2015 |
2016E |
2017E |
|
INCOME : |
|
|
|
|
|
|
Sales Turnover |
3372.57 |
3909.62 |
3801.78 |
4410.06 |
5203.88 |
|
Excise Duty |
37.39 |
40.66 |
46.45 |
48.51 |
57.24 |
|
Net Sales |
3335.18 |
3868.96 |
3755.33 |
4361.55 |
5146.63 |
|
Other Income |
22.44 |
16.31 |
34.47 |
23.34 |
28.86 |
|
Stock Adjustments |
0.96 |
-22.41 |
93.65 |
20.97 |
22.43 |
|
Total Income |
3358.58 |
3862.86 |
3883.45 |
4405.87 |
5197.93 |
|
EXPENDITURE : |
|
|
|
|
|
|
Raw Materials |
1842.43 |
2029.67 |
2024.5 |
2205.03 |
2653.98 |
|
Power & Fuel Cost |
265.44 |
291.84 |
322.38 |
330.75 |
390.29 |
|
Employee Cost |
237.86 |
287 |
387.16 |
441.01 |
520.39 |
|
Other Manufacturing Expenses |
164.99 |
201.64 |
202.75 |
224.91 |
265.40 |
|
Selling and Administration Expenses |
182.11 |
254.05 |
233.19 |
308.70 |
312.23 |
|
Miscellaneous Expenses |
87.98 |
54.74 |
18.23 |
54.96 |
65.40 |
|
Total Expenditure |
2780.81 |
3118.94 |
3188.21 |
3565.37 |
4207.78 |
|
Operating Profit |
577.77 |
743.92 |
695.24 |
840.50 |
990.15 |
|
Interest |
235.28 |
210.33 |
205.96 |
244.65 |
215.87 |
|
Gross Profit |
342.49 |
533.59 |
489.28 |
595.85 |
774.28 |
|
Depreciation |
261.44 |
268.41 |
321.32 |
413.16 |
477.99 |
|
Profit Before Tax |
81.05 |
265.18 |
167.96 |
182.68 |
296.29 |
|
Tax |
0.73 |
66.91 |
0.11 |
0.42 |
0.56 |
|
Deferred Tax |
31.03 |
1.22 |
49.99 |
20.11 |
17.40 |
|
Net Profit |
49.29 |
197.05 |
117.86 |
162.15 |
265.95 |
|
Profit/Loss of Associate Company |
0.02 |
-3.03 |
0 |
0.00 |
0.00 |
|
Net Profit after Minority Interest & P/L Asso.Co. |
49.31 |
194.02 |
117.86 |
162.15 |
265.95 |
|
Extraordinary Items |
0.75 |
-3.25 |
0.42 |
0.49 |
0.26 |
|
Adjusted Net Profit |
48.56 |
197.27 |
117.44 |
161.66 |
265.69 |
Balance Sheet as per rough estimates
|
|
2013 |
2014 |
2015 |
2016E |
2017E |
|
SOURCES OF FUNDS : |
|
|
|
|
|
|
Share Capital |
310.84 |
311.09 |
508.64 |
508.64 |
508.64 |
|
Reserves Total |
395.29 |
573.74 |
946.71 |
1078.34 |
1119.81 |
|
Equity Share Warrants |
0 |
43 |
0 |
0.00 |
0.00 |
|
Total Shareholders Funds |
706.13 |
927.83 |
1455.35 |
1586.98 |
1628.45 |
|
Secured Loans |
2239.81 |
1862.27 |
2580.14 |
3495.00 |
3321.08 |
|
Total Debt |
2239.81 |
1862.27 |
2580.14 |
3495.00 |
3321.08 |
|
Other Liabilities |
4.29 |
4.53 |
40.51 |
40.51 |
40.51 |
|
Total Liabilities |
2950.23 |
2794.63 |
4076 |
5122.49 |
4990.04 |
|
APPLICATION OF FUNDS : |
|
|
|
|
|
|
Gross Block |
3405.63 |
3485.76 |
4868.79 |
5868.79 |
6507.69 |
|
Less: Accumulated Depreciation |
1437.41 |
1690.17 |
2004.89 |
2112.76 |
2830.85 |
|
Net Block |
1968.22 |
1795.59 |
2863.9 |
3756.03 |
3676.84 |
|
Capital Work in Progress |
28.05 |
36.28 |
221.89 |
130.24 |
0.00 |
|
Investments |
63.87 |
115.2 |
30.85 |
60.56 |
65.20 |
|
Current Assets, Loans & Advances |
|
|
|
|
|
|
Inventories |
691.08 |
642.85 |
750.78 |
940.56 |
966.32 |
|
Sundry Debtors |
232.21 |
264.14 |
203.33 |
225.80 |
235.29 |
|
Cash and Bank |
33.57 |
25.01 |
17.01 |
25.05 |
23.73 |
|
Loans and Advances |
147.29 |
150.98 |
246.45 |
196.78 |
188.04 |
|
Total Current Assets |
1104.15 |
1082.98 |
1217.57 |
1388.19 |
1413.38 |
|
Less : Current Liabilities and Provisions |
|
|
|
|
|
|
Current Liabilities |
226.73 |
259.3 |
302.33 |
311.79 |
270.33 |
|
Provisions |
2.78 |
19.33 |
4.46 |
8.97 |
12.23 |
|
Total Current Liabilities |
229.51 |
278.63 |
306.79 |
320.76 |
282.56 |
|
Net Current Assets |
874.64 |
804.35 |
910.78 |
1067.43 |
1130.82 |
|
Deferred Tax Assets |
35.91 |
14.89 |
48.09 |
45.70 |
44.39 |
|
Deferred Tax Liability |
142.92 |
123.12 |
172.3 |
164.39 |
166.66 |
|
Net Deferred Tax |
-107.01 |
-108.23 |
-124.21 |
-118.69 |
-122.27 |
|
Other Assets |
122.46 |
151.44 |
172.79 |
226.93 |
239.90 |
|
Total Assets |
2950.23 |
2794.63 |
4076 |
5122.49 |
4990.04 |
Conclusion and Recommendation
We are positive on Trident over the long term and hence recommend a BUY at CMP of Rs.41.20 and further add on declines between Rs.37 to Rs.35 for a target of Rs.48 to Rs.52 with stop loss maintained at Rs.34.
- Share :


Post a Comment
|
DISCLAIMER |
This report is only for the information of our customers. Recommendations, opinions, or suggestions are given with the understanding that readers acting on this information assume all risks involved. The information provided herein is not to be construed as an offer to buy or sell securities of any kind. ATS and/or its group companies do not as assume any responsibility or liability resulting from the use of such information.