TATA Power Company Limited Research Report
|
Industry |
Market Price |
Recommendation |
Target |
Time Horizon |
|
Energy |
207.50 |
Buy |
245 |
8 months |
Q4 FY 2022 Review
TATA Power Company Limited reported net revenue of ₹11,959.96 crores for the quarter ended March 31, 2022, compared to ₹10,362.60 crores for March 31, 2021. EBIT and Net Profit were ₹1282.28 crores and ₹632.37 crores for the quarter ended, 31, March 2022, as compared to ₹988.22 crores and ₹481.21 crores, during the corresponding quarter of the previous year.
TATA Power Company Limited - Investment Summary
|
CMP (₹) |
207.50 |
|
52 Week H/L |
298/118 |
|
Market Cap (crores) |
64,849 |
|
Face Value (₹) |
1.00 |
|
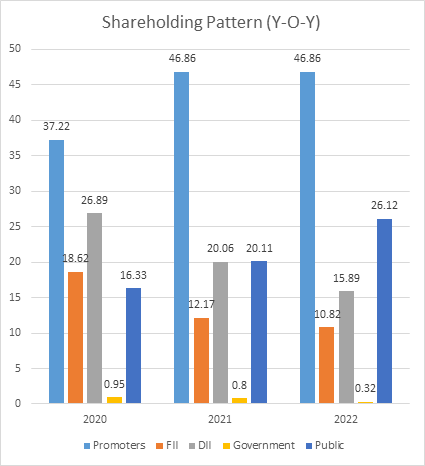
Promoter Holding (%) |
46.86 |
|
Non-Promoter Holding (%) |
53.14 |
|
Total (%) |
100.00 |
|
Book Value |
₹70.20 |
|
EPS TTM |
₹6.96 |
TATA Power Company Limited - Overview
-
TATA Power Company Limited, along with its subsidiaries and joint ventures, is India's largest private sector power utility, with over 13,515 MW of installed power generation capacity.
-
TATA Power operates in all segments of the power industry, including generation (thermal, hydro, solar, wind, and liquid fuel), transmission, and distribution.
-
TATA Power has committed to achieving carbon neutrality before 2050.
-
The company has been assigned an AA stable credit rating on a long-term bank facility.
Beta: 1.10 |
Alpha: 32.19 |
Risk Reward Ratio: 1.32 |
Margin of Safety: 16% |
TATA Power Company Limited - Quarterly Summary
|
Particular |
Mar-22 |
Dec-21 |
Sep-21 |
Jun-21 |
Mar-21 |
|
Revenue from Operations |
11,959.96 |
10,913.14 |
9,810.22 |
10,132.35 |
10,362.60 |
|
Other income |
259.40 |
105.59 |
377.11 |
177.86 |
95.09 |
|
Total Income |
12,219.36 |
11,018.73 |
10,187.33 |
10,310.21 |
10,457.69 |
|
|
|||||
|
Total Expenditure |
10,937.08 |
10,037.50 |
8,917.75 |
8,534.37 |
9,469.47 |
|
EBIT |
1,282.28 |
981.23 |
1,269.58 |
1,775.84 |
988.22 |
|
|
|||||
|
Finance cost |
1,014.60 |
952.60 |
946.39 |
945.43 |
890.49 |
|
EBT before Exceptional Items |
267.68 |
28.63 |
323.19 |
830.41 |
97.73 |
|
|
|||||
|
Exceptional items |
270.88 |
759.86 |
314.55 |
207.80 |
364.92 |
|
PBT |
538.56 |
788.49 |
637.74 |
1,038.21 |
462.65 |
|
|
|||||
|
Tax Expenses |
-561.64 |
236.60 |
132.08 |
572.59 |
-107.79 |
|
PAT from Continued Operations |
1,100.20 |
551.89 |
505.66 |
465.62 |
570.44 |
|
Profit from Discontinued Operations |
-467.83 |
-89.23 |
|||
|
Net Profit |
632.37 |
551.89 |
505.66 |
465.62 |
481.21 |
Business
-
TATA Power Company Limited, with over 13,515 MW of installed power generation capacity, is India's largest private sector power utility. It has been in business for over 107 years, having begun its operations in 1915.
-
The company operates in all areas of the power industry, including generation, transmission, and distribution.
-
Tata Power currently has 34% clean energy generation in its portfolio, which includes solar and wind generation. They hope to increase this to 50-60 percent in the coming years.
-
During FY20, the company was awarded a long-term coal mining license for the Krutogorovskya coal deposit in the Russian Federation's Sobolevo District, Kamchatka, to explore cheaper and sustainable coal supply for its subsidiary, Coastal Gujarat Power Limited (CGPL).
-
In order to achieve zero carbon emissions, the company intends to limit its exposure to thermal projects and will not expand its coal-fired power plant beyond its current size.
-
In FY20, the company partnered with the Rockefeller Foundation to deploy 10,000 microgrids in order to provide innovative solutions for underserved communities and expand the global microgrid footprint.
-
Tata Power has signed a Power Purchase Agreement with Apollo Gleneagles Hospital in Kolkata to commission
-
India's largest health sector carport in FY21, as well as a Power Purchase Agreement with Tata Motors to commission India's Largest Carport in Pune.
-
Tata Power took over power distribution in Western and Southern Odisha on January 1, 2021, after acquiring four distribution entities in the state (CESU, WESCO, SOUTHCO, and NESCO).
-
The Company has major plans to scale up consumer businesses, such as rooftop solar, EV charging, solar pumps, microgrids, energy efficiency solutions, and home automation.
-
Segments and Value Chain
Segments
Capacity
Renewable Energy Generation
3,400 (MW)
Conventional Energy Generation
10,115 (MW)
Transmission
3,552 Ckm
Distribution
12.3 million Customer Base
EV Charging Infrastructure
2200+ Charging points
-
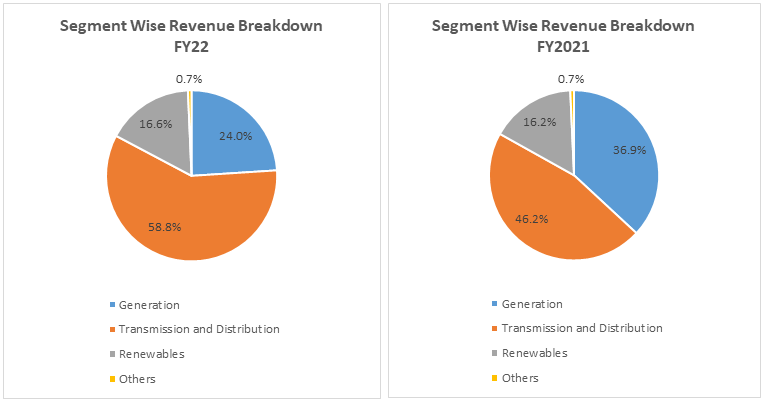
Out of the total revenue, 24% of revenue have been generated from Generation activities, 16.6% from Renewables, 58.8% from Transmission and Generation, and 0.7% from others % in FY 2022, compared to 36.9%, 16.2%, 46.2% and 0.7% in FY 2021.
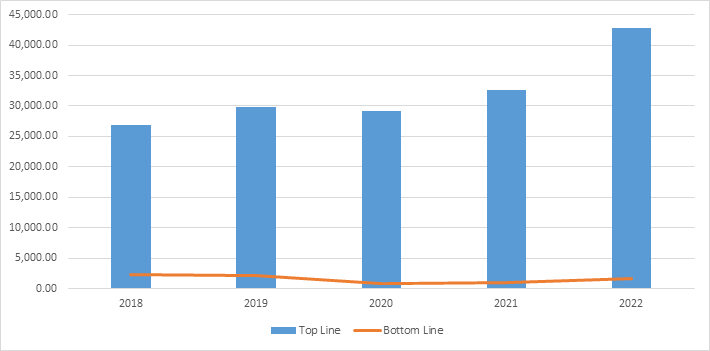
TATA Power Company Limited - Revenue Trend
TATA Power Company Limited - Topline and Bottomline trend (crores)
TATA Power Company Limited - Ratio Analysis
|
|
Mar-18 |
Mar-19 |
Mar-20 |
Mar-21 |
Mar-22 |
|
Profitability Ratio |
|||||
|
Gross Profit |
43.46% |
41.05% |
46.53% |
48.11% |
48.59% |
|
EBITDA Margin |
24.98% |
23.87% |
29.19% |
22.76% |
19.69% |
|
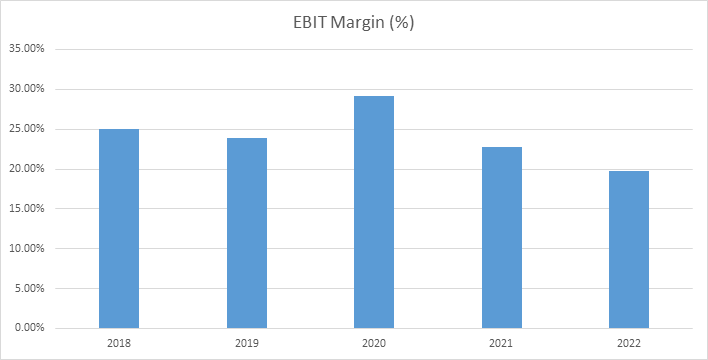
EBIT Margin |
16.24% |
15.86% |
20.15% |
14.36% |
12.40% |
|
Pre-Tax Margin |
10.60% |
12.78% |
8.13% |
6.08% |
7.01% |
|
Net Profit Margin |
8.56% |
7.31% |
2.90% |
2.92% |
4.00% |
|
|
|||||
|
Return on Investment |
|||||
|
Return on Asset – ROA |
2.63% |
0.97% |
1.01% |
1.62% |
|
|
Return on Capital Employed – ROCE |
8.54% |
7.91% |
8.97% |
6.62% |
|
|
Return on Equity – ROE |
11.24% |
4.00% |
4.06% |
6.68% |
|
|
|
|||||
|
Liquidity Ratio |
|||||
|
Current ratio (x) |
0.26 |
0.37 |
0.45 |
0.52 |
0.56 |
|
Quick Ratio |
0.22 |
0.31 |
0.39 |
0.46 |
0.45 |
|
|
|||||
|
Turnover Ratio |
|||||
|
Receivables Turnover |
44.18 |
55.57 |
53.72 |
47.65 |
|
|
Inventory Turnover |
33.76 |
39.10 |
38.14 |
48.68 |
|
|
Payables Turnover |
112.46 |
119.58 |
128.33 |
140.12 |
|
|
Asset Turnover |
0.36 |
0.34 |
0.35 |
0.40 |
|
|
|
|||||
|
Solvency Ratio |
|||||
|
Debt to Equity |
3.38 |
3.06 |
3.05 |
2.91 |
3.31 |
|
Interest Coverage Ratio |
1.2 |
1.1 |
1.3 |
1.2 |
1.4 |
TATA Power Company Limited - Financial Overview
TATA Power Company Limited - Profit and Loss Statement (₹ in crores)
|
Particular |
Mar-18 |
Mar-19 |
Mar-20 |
Mar-21 |
Mar-22 |
|
Revenue |
26,840.27 |
29,881.06 |
29,136.37 |
32,703.31 |
42,815.6 |
|
Other income |
432.69 |
386.15 |
562.61 |
439.24 |
919.96 |
|
Total Revenue |
27,272.96 |
30,267.21 |
29,698.98 |
33,142.55 |
43,735.6 |
|
Cost of Power Purchased |
5,597.32 |
6,359.53 |
6,220.46 |
8,334.41 |
14,640.6 |
|
Cost of Fuel |
10,009.86 |
11,640.02 |
9,922.39 |
9,074.96 |
8,290.92 |
|
Gross Profit |
11,665.78 |
12,267.66 |
13,556.13 |
15,733.18 |
20,804.0 |
|
Transmission Charges |
281.99 |
248.23 |
214 |
504.6 |
1,018.19 |
|
Raw Material Consumed |
748.97 |
919.35 |
957.18 |
2,628.19 |
3,832.83 |
|
Purchase of Finished Goods, Spares and Shares |
181.68 |
345.22 |
111.74 |
28.89 |
49.11 |
|
(Increase)/Decrease in Stock-in-Trade and Work in Progress |
-8.51 |
24.37 |
-15.64 |
0.41 |
-199.22 |
|
Employees Benefits Expenses |
1,381.92 |
1,339.05 |
1,440.64 |
2,316.67 |
3,611.63 |
|
Other Expenses |
2,374.11 |
2,260.15 |
2,342.78 |
2,812.48 |
4,060.42 |
|
EBITDA |
6,705.62 |
7,131.29 |
8,505.43 |
7,441.94 |
8,431.13 |
|
Depreciation, Amortisation, and Impairment |
2,346.17 |
2,393.13 |
2,633.56 |
2,744.94 |
3,122.20 |
|
EBIT |
4,359.45 |
4,738.16 |
5,871.87 |
4,697.00 |
5,308.93 |
|
Finance cost |
3,761.48 |
4,170.00 |
4,493.73 |
4,010.39 |
3,859.02 |
|
EBT before Exceptional Items |
597.97 |
568.16 |
1,378.14 |
686.61 |
1,449.91 |
|
Share of Net Profit of Associates and Joint Ventures |
1,553.91 |
1,401.83 |
952.55 |
873.39 |
1,942.83 |
|
Net movement in Regulatory Deferral Balance |
-409.85 |
103.27 |
-188.69 |
536.02 |
-239.47 |
|
Exceptional items |
1,102.53 |
1,745.83 |
226.16 |
-109.29 |
-150.27 |
|
EBT |
2,844.56 |
3,819.09 |
2,368.16 |
1,986.73 |
3,003.00 |
|
tax expenses |
161.97 |
1,087.59 |
641.49 |
501.88 |
379.56 |
|
Profit from Continuing Operations |
2,682.59 |
2,731.50 |
1,726.67 |
1,484.85 |
2,623.44 |
|
Loss for the Year from Discontinued Operations |
-71.74 |
-125.84 |
-410.23 |
-46.2 |
-467.83 |
|
PAT before Non-Controlling Interest and non-perpetual Securities |
2,610.85 |
2,605.66 |
1,316.44 |
1,438.65 |
2,155.61 |
|
Non-Controlling Interest |
202.55 |
249.47 |
299.06 |
311.27 |
414.15 |
|
Net Profit before non-perpetual Securities |
2,408.30 |
2,356.19 |
1,017.38 |
1,127.38 |
1,741.46 |
|
Distribution of Perpetual Securities |
111.82 |
171 |
171 |
171.23 |
29.52 |
|
Net Profit attributable to Owner of the company |
2,296.48 |
2,185.19 |
846.38 |
956.15 |
1,711.94 |
|
EPS |
|||||
|
Basic |
8.48 |
8.07 |
3.13 |
3.17 |
5.35 |
|
Diluted |
8.48 |
8.07 |
3.13 |
3.17 |
5.35 |
|
Number of shares |
|||||
|
Basic |
270.76 |
270.76 |
270.76 |
301.81 |
319.82 |
|
Diluted |
270.76 |
270.76 |
270.76 |
301.81 |
319.82 |
TATA Power Company Limited - Cash Flow Statement (₹ in crores)
|
|
Mar-18 |
Mar-19 |
Mar-20 |
Mar-21 |
Mar-22 |
|
Net Profit Before Tax |
2,844.56 |
3,819.09 |
2,368.16 |
1,986.73 |
3,003.00 |
|
Net Cash from Operating Activities |
6,363.85 |
4,573.79 |
7,375.32 |
8,345.12 |
6,692.73 |
|
Net Cash Used for Investing Activities |
-1,517.86 |
-319.24 |
-542.93 |
667.60 |
-6,276.57 |
|
Net Cash From (Used For) Financing Activities |
-4,726.26 |
-5,184.45 |
-5,109.57 |
-7,602.88 |
-1,183.20 |
|
Net Increase in Cash and Cash Equivalents |
119.73 |
-929.90 |
1,722.82 |
1,409.84 |
-767.04 |
|
Cash And Cash Equivalents at The Beginning of The Year |
818.58 |
944.52 |
61.52 |
1834.38 |
3569.95 |
|
Cash And Cash Equivalents at The End of Year |
944.52 |
61.52 |
1,834.38 |
3,569.95 |
2,829.01 |
TATA Power Company Limited - Balance Sheet (₹ in crores)
|
Mar-18 |
Mar-19 |
Mar-20 |
Mar-21 |
Mar-22 |
|
|
ASSETS:- |
|||||
|
Non-Current Assets: |
|||||
|
Property, Plant & Equipment |
41,431.61 |
41,101.50 |
44,662.61 |
45,356.46 |
50,502.96 |
|
Right of Use Assets |
3,682.27 |
3,661.99 |
|||
|
Capital WIP |
1,652.60 |
2,575.70 |
1,611.52 |
3,270.26 |
4,635.10 |
|
Goodwill |
1,641.57 |
1,641.57 |
1,641.57 |
1,794.57 |
1,858.31 |
|
Other intangible assets |
1,583.08 |
1,561.82 |
1,362.18 |
1,345.85 |
1,366.18 |
|
Investments accounted for using the Equity Method |
11,530.27 |
12,513.48 |
13,202.65 |
11,920.63 |
12,580.00 |
|
Financial Assets: |
|||||
|
Other Investments |
881.11 |
861.41 |
632.68 |
728.88 |
1,169.81 |
|
Trade Receivables |
190.05 |
192.99 |
30.28 |
604.71 |
685.78 |
|
Loans |
77.56 |
90.56 |
80.88 |
4.6 |
3.45 |
|
Finance Lease Receivables |
574.76 |
565.62 |
588.92 |
598.61 |
588.69 |
|
Other financial assets |
273.68 |
316.75 |
578.79 |
1,919.25 |
1,684.53 |
|
Non-Current Tax Assets (net) |
167.59 |
238.01 |
342 |
359.83 |
520.54 |
|
Deferred tax assets (net) |
118.17 |
89.49 |
74.24 |
184.02 |
334.6 |
|
Other non-current assets |
1,577.31 |
1,358.07 |
1,185.12 |
1,459.24 |
1,849.82 |
|
Total Non Current Assets |
61,699.36 |
63,106.97 |
65,993.44 |
73,229.18 |
81,441.76 |
|
Current Assets: |
|||||
|
Inventories |
1,623.08 |
1,706.42 |
1,752.35 |
1,885.62 |
4,231.52 |
|
Financial Assets: |
|||||
|
Investments |
436.16 |
166.98 |
699.51 |
499.54 |
410.52 |
|
Trade Receivables |
2,788.93 |
4,445.26 |
4,425.90 |
5,200.08 |
5,979.74 |
|
Unbilled Revenue |
810.09 |
837.85 |
799.42 |
1,591.14 |
2,285.57 |
|
Cash and cash equivalents |
1,061.16 |
645.45 |
1,861.50 |
3,669.62 |
3,077.24 |
|
Bank balances other than cash and cash equivalents |
124.62 |
142.00 |
232.68 |
2,201.05 |
3,563.46 |
|
Loans |
754.47 |
87.18 |
33.00 |
7.63 |
9.34 |
|
Finance Lease Receivables |
34.27 |
37.90 |
33.20 |
41.45 |
46.91 |
|
Other Financial Assets |
401.59 |
241.59 |
1,412.43 |
329.61 |
501.45 |
|
Current Tax Assets (Net) |
14.77 |
2.67 |
1.10 |
0.01 |
|
|
Other Current Assets |
1,512.32 |
1,881.85 |
770.39 |
914.04 |
1,479.67 |
|
Total Current Assets |
9,561.46 |
10,195.15 |
12,021.48 |
16,339.78 |
21,585.43 |
|
Assets Classified as Held For Sale |
4,339.26 |
5,102.68 |
6,253.06 |
3,047.46 |
3,046.83 |
|
Regulatory Deferral Account - Assets . |
6,304.56 |
5,758.13 |
5,480.17 |
6,222.44 |
6,810.57 |
|
Total Assets |
81,904.64 |
84,162.93 |
89,748.15 |
98,838.86 |
1,12,884.59 |
|
EQUITIES & LIABILITIES |
|||||
|
Equity |
|||||
|
Equity share capital |
270.5 |
270.5 |
270.5 |
319.56 |
319.56 |
|
Unsecured Perpetual Securities |
1,500.00 |
1,500.00 |
1,500.00 |
1,500.00 |
|
|
Other equity |
14,608.55 |
16,535.01 |
17,795.52 |
20,502.70 |
22,122.00 |
|
Equity attributable to owners of the company |
16,379.05 |
18,305.51 |
19,566.02 |
22,322.26 |
22,441.56 |
|
Non-controlling interests |
2,015.29 |
2,166.66 |
2,332.04 |
2,927.30 |
3,586.90 |
|
Total Equity |
18,394.34 |
20,472.17 |
21,898.06 |
25,249.56 |
26,028.46 |
|
Liabilities: |
|||||
|
Non Current Liabilities |
|||||
|
Financial Liabilities |
|||||
|
Borrowings |
22,356.31 |
31,139.23 |
32,695.14 |
30,044.85 |
32,729.70 |
|
Lease Liabilities |
3,180.48 |
3,142.48 |
3,207.79 |
||
|
Trade Payables |
21.00 |
22.75 |
1.67 |
||
|
Other financial liabilities |
647.31 |
687.31 |
721.52 |
1,371.00 |
1,156.56 |
|
Noncurrent tax liabilities |
3.74 |
3.74 |
3.03 |
3.03 |
3.03 |
|
Deferred tax liabilities |
516.56 |
1,056.81 |
1,174.04 |
976.15 |
1,033.30 |
|
Provisions |
300.00 |
333.60 |
407.40 |
667.27 |
1,218.18 |
|
other non current liabilities |
1,841.48 |
1,873.75 |
2,084.52 |
5,987.06 |
8,139.29 |
|
Total Non Current Liabilities |
25,686.40 |
35,117.19 |
40,266.13 |
42,193.51 |
47,487.85 |
|
Current Liabilities |
|||||
|
Financial Liabilities |
|||||
|
Borrowings |
18,827.28 |
13,875.38 |
11,844.36 |
13,125.79 |
14,860.30 |
|
Lease Liabilities |
379.74 |
394.83 |
397.33 |
||
|
Trade Payables |
5,609.82 |
5,481.49 |
5,095.44 |
7,146.41 |
10,459.60 |
|
Other Financial Liabilities |
9,942.98 |
6,480.79 |
7,502.90 |
7,647.70 |
9,631.96 |
|
Current tax liabilities (Net) |
160.38 |
150.22 |
129.49 |
198.38 |
147 |
|
Provisions |
108.94 |
93.55 |
116.42 |
163.31 |
344.82 |
|
Other Current Liabilities |
1,785.72 |
1,499.64 |
1,453.08 |
2,480.66 |
2,779.08 |
|
Total Current Liabilities |
36,435.12 |
27,581.07 |
26,521.43 |
31,157.08 |
38,620.09 |
|
Liabilities directly associated with Assets Classified as Held For Sale |
903.78 |
992.5 |
1,062.53 |
139.78 |
113.56 |
|
Regulatory Deferral Account - Liability |
485 |
98.93 |
634.63 |
||
|
Total Equity and Liabilities |
81,904.64 |
84,162.93 |
89,748.15 |
98,838.86 |
1,12,884.59 |
Industry Overview
-
With an installed power capacity of 395.07GW as of January 2022, India is the world's third-largest producer and second-largest consumer of electricity.
-
More industrial activity will drive up energy demand, while a growing population, increased electrification, and per-capita usage will give an additional push.
-
In January 2022, India's installed renewable energy capacity was 152.36 GW, accounting for 38.56% of the total installed power capacity.
-
India is on track to achieve the Saubhagya scheme's goal of 100 % hold electrification. The Saubhagya project had electrified about 2.82 crore households as of March 2021.
-
The government earmarked Rs.19,500 crore (the US $2.57 billion) in the Union Budget 2022-23 for a PLI scheme to stimulate the manufacturing of high-efficiency solar modules.
-
The Government has allowed 100% FDI in the power sector, which has boosted FDI inflow in this sector.
-
Between FY19 and FY23, India's electricity sector is expected to attract investment worth Rs. 9-9.5 trillion (US $128.24-135.37 billion).
-
India wants to lower the emissions intensity of its gross domestic product (GDP) to 33% by 2030 from 35% and boost the use of non-fossil fuels to 40% of total energy generation capacity.
-
From April 2000 to December 2021, India received US$ 11.21 billion in FDI in the non-conventional energy industry. Since 2000, the new renewable energy sectors have added the most power-producing capacity.
-
Coal-based capacity continues to dominate India's total installed capacity, accounting for half of all installed capacity, However the share has steadily declined over the last ten years, falling from 56 percent in FY12 to around 52 percent in FY22. Despite the fact that coal is expected to remain a primary source of electricity generation until 2030, decarbonization is fueling exponential growth in renewable capacity installations, led by solar and wind.
-
Microgrids and battery energy storage systems have become common grid components. Advanced nuclear power designs and hydrogen-based energy schemes are gradually progressing, and carbon capture and storage (CCS) is becoming the new norm, focusing on climate change as industrialization accelerates.
-
Electric vehicles are rapidly expanding as they play a critical role in the ambitious zero-emission targets set by nations around the world. EV sales have been steadily increasing in recent years.
-
India's per capita power consumption has been increasing at a rate of roughly 5% per year, reaching 1208 kWh/person by FY 2019-20, which is low compared to the global average of around 3316 kWh/person. This opens the door for more development in this sector.
Concall Overview (Q3FY2021)
-
The company has secured a 10-year extension of its Indonesian coal mining license with revised royalty and taxation norms, which will have a largely neutral impact on coal business profits.
-
Tata Power has signed a binding agreement with a consortium of BlackRock and Mubadala to raise 4,000 crores for its renewable platform, which will create the most comprehensive renewable platform with Utility-Scale businesses, such as large solar capacities, EPC, and manufacturing, as well as customer-centric businesses such as Rooftop Solar, Solar Pumps, and EV Charging.
-
Coal mine operations were hampered in the fourth quarter due to supply issues and heavy rains in Indonesia from January to March.
-
The company has completed the merger of CGPL with Tata Power Standalone, w.e.f. April 1, 2020. The union of CGPL and Tata Power will assist the company in streamlining operations and utilizing capital more efficiently across the various businesses in the standalone entity, in addition to other financial synergies.
TATA Power Company Limited - Technical Analysis
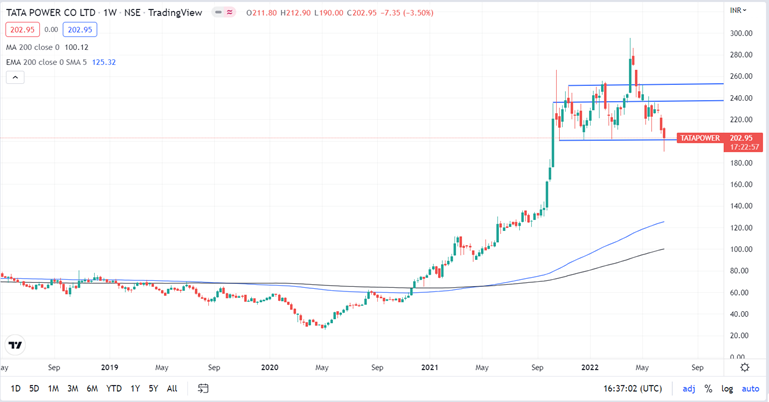
-
Stock is trading above EMA 200 and MA 200 indicators, with a support level of ₹200 and a resistance level at ₹238.
-
One can accumulate this share at the current price.
Recommendation Rationale:
-
For the FY22, TATA Power Company Limited revenue increased to ₹ 42,815.67 crores, compared to the previous year at ₹32,703.31. It also registered a net Profit After Tax of ₹1711.94 crores compared to the last year at ₹956.15 crores.
-
The company's Transmission & Distribution business serves over 12 million customers in 4 Indian states and union territories, with over 3,500 circuit km of transmission lines. The SOAR strategy is expected to grow the business in the long run. Its goal is to have more than 40 million customers and a transmission capacity of more than 10,000 circuit km.
-
The company has got eligible for the PLI scheme.
-
Over the next five years, the company plans to increase its clean energy portfolio by more than 60 percent.
-
Tata Power EZ Charge installed 13,000+ home chargers and 2,200+ EV charging points until the end of FY22, demonstrating the company's success in the EV business.
-
The company has also created a strong software platform for EV charging customers and released a mobile-based application (Tata Power EZ Charge) to provide value-added services to customers.
-
It has installed over 191 microgrids as of March 2022, benefiting a rural consumer base of over 14,000 people.
-
The company has secured a 10-year extension of its Indonesian coal mining license with revised royalty and taxation norms, which will have a largely neutral impact on coal business profits.
-
Recent collaborations in the EV infrastructure space include:
-
An agreement with TVS Motor Company to collaborate on an electric two-wheeler charging ecosystem in India.
-
Collaboration with Apollo Tyers to install charging stations at its vehicle zones across India
-
Tata Power and Am Stays & Trails have teamed up to install EV charging stations to promote greener tourism.
Valuation
-
The company’s revenue has increased at a CAGR of 12.38% from FY 2019-2022.
-
The company’s ROE and ROCE for the year 2022 were 6.68% and 6.62%, respectively.
-
Q1FY2023 results could be impacted due to the increasing inflation and increasing coal prices.
-
Based on the company's performance in FY22 and the increasing government effort to generate carbon-free electricity, TATA Power can benefit and is expected to generate more revenue.
-
We have taken data for the last five years (2018-2022) and forecasted revenue for FY 2023-2027. Revenue growth is assumed to be %.
Estimated Income Statement (₹ in crores):
|
|
Mar-23 |
Mar-24 |
Mar-25 |
Mar-26 |
Mar-27 |
|
|
2023-E |
2024-E |
2023-E |
2024-E |
2023-E |
|
Revenue |
49,558.63 |
56,168.94 |
63,673.25 |
72,192.72 |
81,864.94 |
|
COGS |
26,286.95 |
29,604.36 |
33,698.42 |
38,311.90 |
43,437.29 |
|
Gross Profit |
23,271.68 |
26,564.57 |
29,974.83 |
33,880.82 |
38,427.65 |
|
Employee Expenses |
3,772.74 |
4,470.75 |
4,970.95 |
5,705.00 |
6,444.29 |
|
Other Expenses |
9,415.78 |
10,995.12 |
12,313.81 |
14,080.84 |
15,934.37 |
|
EBITDA |
10,083.16 |
11,098.71 |
12,690.08 |
14,094.98 |
16,048.98 |
|
Depreciation |
3,352.99 |
3,434.83 |
3,550.89 |
3,704.36 |
3,898.99 |
|
EBIT |
6,730.17 |
7,663.88 |
9,139.19 |
10,390.62 |
12,149.99 |
|
Financial Cost |
4,892.11 |
5,570.81 |
6,643.21 |
7,552.86 |
8,831.74 |
|
EBT |
1,838.06 |
2,093.06 |
2,495.98 |
2,837.76 |
3,318.26 |
|
Tax expenses |
232.32 |
264.55 |
315.48 |
358.67 |
419.41 |
|
PAT |
1,605.74 |
1,828.51 |
2,180.51 |
2,479.08 |
2,898.85 |
-
We initiate coverage on TATA Power Company Limited with a “BUY” and a 8 month Target Price of 245.
Disclaimer: This report is only for the information of our customers Recommendations, opinions, or suggestions are given with the understanding that readers acting on this information assume all risks involved. The information provided herein is not to be construed as an offer to buy or sell securities of any kind.
- Share :


Post a Comment
|
DISCLAIMER |
This report is only for the information of our customers. Recommendations, opinions, or suggestions are given with the understanding that readers acting on this information assume all risks involved. The information provided herein is not to be construed as an offer to buy or sell securities of any kind. ATS and/or its group companies do not as assume any responsibility or liability resulting from the use of such information.