Suprajit Engineering Limited Research Report
|
Market Price |
Recommendation |
Target |
Time Horizon |
|
321 |
Buy |
439 |
1-Year |
Suprajit Engineering Limited - Q2FY2023 REVIEW
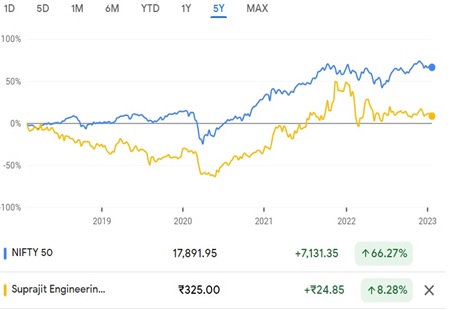
Suprajit Engineering Limited reported net revenue of ₹737.81 crores for the quarter ended September 30, 2022, compared to ₹508.85 crores for September 30, 2021. Profit After Tax was ₹45.75 crores for the quarter ended September 30, 2022, compared to ₹49.55 crores during the corresponding quarter of the previous year, respectively.
STOCK DATA
|
52 Week H/L |
272.05/470 |
|
Market Cap (crores) |
4,442 |
|
Face Value (₹) |
1.00 |
|
Book Value |
78.33 |
|
EPS TTM |
12.48 |
|
NSE Code |
SUPRAJIT |
Suprajit Engineering Limited - OVERVIEW
-
With an annual worldwide capacity of 400 million cables and 110 million halogen lights, Suprajit is India's largest automotive cable and halogen bulb manufacturer.
-
The majority of Indian automotive giants are on Suprajit's list of clients. Suprajit also exports to a variety of prestigious global clients.
-
Suprajit Engineering has been rated AA & A1+ for long-term and short-term Funds by ICRA Rating Agency.
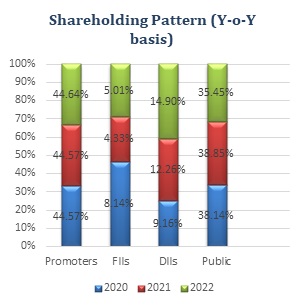
SHAREHOLDING PATTERN (%)
|
|
June-22 |
Sep-22 |
Dec-22 |
|
Promoter |
44.64 |
44.64 |
44.64 |
|
Public |
35.60 |
34.72 |
34.65 |
|
FII |
4.95 |
5.42 |
5.10 |
|
DII |
14.81 |
15.20 |
15.62 |
Suprajit Engineering Limited - BENCHMARK COMPARISON
Beta: 0.89 |
Alpha: 9.56 |
Risk Reward Ratio: 1.63 |
Margin of Safety: 25% |
BUSINESS
-
Suprajit, which was founded in 1985 with an entrepreneurial attitude, has established itself as a pioneer in the design and production of mechanical control cables. It is now known as the largest cable manufacturer in India and the largest in the world for the two-wheeler cable market.
-
Wescon Controls Inc. USA was purchased by Suprajit in 2015 as part of its strategic development into the non-automotive cables and controls market. Phoenix Lamps Limited was acquired by Suprajit in 2014 to diversify into the automotive lighting industry.
-
Mechanical control cables, speedometers for 2Ws, and halogen lights for 2Ws, 3Ws, passenger cars, commercial vehicles, and off-road applications are among the main products made by Suprajit Engineering Limited for the automotive and non-automotive sectors.
-
A wide range of control cables, including brake cables, clutch cables, throttle cables, starting cables, gear shifter cables, choke cables, tachometer cables, window regulator cables, mirror cable assemblies, seat recliner cables, and latch release cables, are included in SEL's product profile in its cables division.
-
Fog lights, side position lights, front lights, position and parking lights, dashboard and interior lights, brake light lamps, trunk lights, front indicator lights, rear parking lights, number plate lights, rear indicator lights, stop lights, low beam/high beam lights, etc. are all included in the SEL product profile under halogen lamps.
-
With 22 production locations (including a technical centre in the UK) spread out over the world, SEL serves both the automotive and non-automotive industries.
-
Reputable 2W OEMs including Bajaj Auto Limited (BAL), Hero MotoCorp Limited, TVS Motor Company Limited, and Honda Motorcycle & Scooter India (HMSI), among others, are included in SEL's customer list.
-
While serving clients including Atul Auto Limited (AAL), Piaggio Vehicles Private Limited (PVPL), and TVS in the 3W market, SEL also serves Mahindra & Mahindra (M&M), BMW AG (BMW), and Volkswagen AG (VW) in the 4W segment. Customers of the business in its non-automotive sector include Club Car LLC, Whirlpool Corporation (WC), Kubota Corporation (Kubota), and John Deere (JD) (Club Car).
-
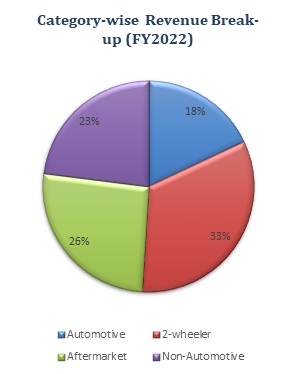
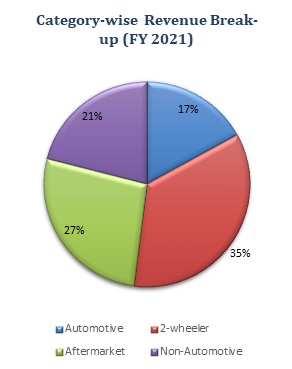
Category-wise Revenue contribution from Automotive was 18%, 2-Wheelers was 33%, Aftermarket was 26% and from Non-Automotive was 23% in FY 2022 compared to 17%, 35%, 27%, and 21% in FY 2021, respectively.
-
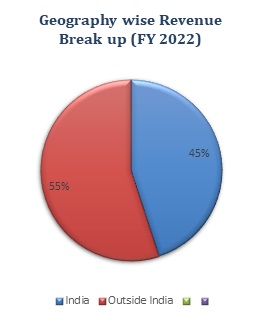
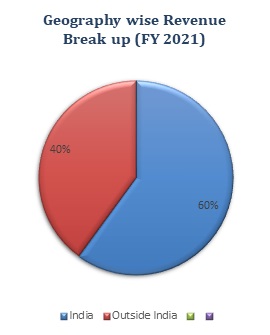
Geographically contribution from India was 55% and from countries were 45% in FY 2022 compared to 40% and 60% in FY 2021, respectively.
Suprajit Engineering Limited - SWOT ANALYSIS
STRENGTH
-
Company with Zero Promoter Pledge.
-
Company with low debt.
-
Effectively using its capital to generate profit.
-
Strong customer base.
WEAKNESS
-
Decline quarterly net profit with a falling profit margin.
-
Exposure to inherent cyclic ability in Indian Automotive Industry.
OPPORTUNITIES
-
Suprajit is among the top three global manufacturers of both, control cables and halogen bulbs, this will create a lot of opportunities with the increasing demand of the automobile industry.
-
The company has a diversified product portfolio and geographical presence.
THREAT
-
Increasing global uncertainty.
-
An increase in prices of raw materials costs could impact the profit of the company.
AUTO COMPONENTS INDUSTRY ANALYSIS
-
Based on domestic demand, notably from the passenger car sector, India's auto components industry saw a rise of 34.8% to ₹2.65 lakh crore in the first half of 2022–23.
-
Exports of components increased by 8.6% over the period to USD 10.1 billion (₹79.03 lakh crore), while imports increased by 17.2% to USD 10.1 billion (₹79.8 lakh crore).
-
The percentage of shipments to North America increased by 12% to 33% of the total. The proportions of Europe and Asia increased by 4% and 11%, respectively, to 30% and 26%, respectively.
-
Exports from the Indian auto component sector, which were valued at $13.3 billion in FY21, are anticipated to increase to $80 billion by 2026. The major export destinations are the USA, Germany, UK, Thailand, and Italy.
-
In the fiscal year 2021–2022, India's auto component sector had its highest-ever trade surplus of $700 million.
-
From $9.8 billion in FY20, the aftermarket category, which includes tyres, batteries, and brake components, is predicted to grow to $32 billion by 2026.
-
By 2025, the whole Indian auto components market, which presently contributes 2.3% of India's GDP, is expected to overtake the United States as the third-largest market worldwide.
-
The Union Cabinet chaired by the Prime Minister, Shri Narendra Modi announced the Production-Linked Incentive (PLI) Scheme in the Automobile and Auto Components sectors. The PLI scheme (outlay of $ 3.5 Bn) for the automobile sector proposes financial incentives of up to 18% to boost domestic manufacturing of advanced automotive technology products and attract investments in the automotive manufacturing value chain.
-
Incentives are applicable for determined sales of products manufactured in India from April 1, 2022, for a period of five consecutive years. The scheme was closed on 9th January 2022. Total of 95 applicants have been approved under this PLI scheme: 20 under Champion OEM and 75 under Component champion.
Suprajit Engineering Limited - FINANCIAL OVERVIEW
Suprajit Engineering Limited - QUARTERLY SUMMARY
|
Quarterly (INR in millions) |
Sep-22 |
Jun-22 |
Mar-22 |
Dec-21 |
Sep-21 |
|
Revenue from Operations |
7,160.63 |
6,451.84 |
5,059.17 |
4,792.74 |
4,936.68 |
|
Other income |
217.43 |
181.42 |
67.94 |
80.62 |
151.81 |
|
Total Income |
7,378.06 |
6,633.26 |
5,127.11 |
4,873.36 |
5,088.49 |
|
|
|
|
|
|
|
|
Total Expenditure |
6,613.01 |
6,149.31 |
4,445.23 |
4,395.88 |
4,282.35 |
|
EBIT |
765.05 |
483.95 |
681.88 |
477.48 |
806.14 |
|
|
|
|
|
|
|
|
Finance cost |
76.83 |
60.52 |
31.93 |
30.66 |
35.35 |
|
EBT before Exceptional Items |
688.22 |
423.43 |
649.95 |
446.82 |
770.79 |
|
|
|
|
|
|
|
|
Exceptional Items |
- |
- |
- |
- |
-44.75 |
|
PBT |
688.22 |
423.43 |
649.95 |
446.82 |
726.04 |
|
|
|
|
|
|
|
|
Tax Expenses |
230.76 |
150.27 |
163.59 |
129.58 |
230.51 |
|
PAT |
457.46 |
273.16 |
486.36 |
317.24 |
495.53 |
Suprajit Engineering Limited - PROFIT AND LOSS STATEMENT (₹ IN Millions)
|
|
Mar-19 |
Mar-20 |
Mar-21 |
Mar-22 |
|
Revenue from Operations |
15,899.00 |
15,628.32 |
16,408.55 |
18,404.77 |
|
Other Income |
379.95 |
223.84 |
335.92 |
366.47 |
|
Total Income |
16,278.95 |
15,852.16 |
16,744.47 |
18,771.24 |
|
|
|
|
|
|
|
Cost of Goods sold |
9,148.17 |
9,150.54 |
9,547.18 |
10,787.34 |
|
Gross Profit |
7,130.78 |
6,701.62 |
7,197.29 |
7,983.90 |
|
|
|
|
|
|
|
Excise Duty |
- |
- |
- |
- |
|
Employee Benefits Expense |
3,036.78 |
2,926.91 |
3,083.45 |
3,363.75 |
|
Other Expenses |
1,386.28 |
1,363.87 |
1,410.71 |
1,654.64 |
|
EBITDA |
2,707.72 |
2,410.84 |
2,703.13 |
2,965.51 |
|
|
|
|
|
|
|
Depreciation and Amortisation Expense |
409.97 |
581.26 |
567.57 |
585.11 |
|
EBIT |
2,297.75 |
1,829.58 |
2,135.56 |
2,380.40 |
|
|
|
|
|
|
|
Finance Costs |
245.54 |
226.57 |
192.18 |
145.23 |
|
EBT before Exceptional Items |
2,052.21 |
1,603.01 |
1,943.38 |
2,235.17 |
|
|
|
|
|
|
|
Exceptional Items |
- |
-274.38 |
- |
116.46 |
|
EBT |
2,052.21 |
1,328.63 |
1,943.38 |
2,351.63 |
|
|
|
|
|
|
|
Tax Expense |
714.27 |
288.98 |
516.28 |
620.86 |
|
PAT |
1,337.94 |
1,039.65 |
1,427.10 |
1,730.77 |
|
|
|
|
|
|
|
EPS |
|
|
|
|
|
Basic |
9.57 |
7.43 |
10.20 |
12.49 |
|
Diluted |
9.57 |
7.43 |
10.20 |
12.47 |
|
|
|
|
|
|
|
Number of Shares |
|
|
|
|
|
Basic |
139.87 |
139.87 |
139.87 |
138.55 |
|
Diluted |
139.87 |
139.87 |
139.87 |
138.74 |
Suprajit Engineering Limited - Balance Sheet (₹ in Millions)
|
|
Mar-19 |
Mar-20 |
Mar-21 |
Mar-22 |
|
ASSETS: |
||||
|
Non-Current Assets: |
||||
|
Property, Plant and Equipment |
3,057.01 |
3,503.54 |
3,465.72 |
3,510.85 |
|
Capital Work-in-Progress |
266.37 |
145.49 |
41.73 |
93.90 |
|
Right-of-use assets |
- |
262.22 |
339.40 |
402.26 |
|
Goodwill |
1,418.35 |
1,374.75 |
1,356.70 |
1,261.00 |
|
Other Intangible Assets |
1,057.77 |
993.94 |
819.36 |
702.03 |
|
Intangible Assets Under Development |
5.44 |
6.24 |
7.61 |
7.82 |
|
Finance Assets: |
|
|
|
|
|
Investments |
- |
889.70 |
347.85 |
30.71 |
|
Other Bank Balances |
5.79 |
5.67 |
- |
- |
|
Loans |
45.95 |
54.50 |
- |
- |
|
Other Financial Assets |
45.71 |
- |
64.07 |
72.94 |
|
Income Tax Assets |
29.50 |
47.65 |
37.90 |
22.06 |
|
Deferred Tax Asset |
0.32 |
- |
- |
- |
|
Other Non-Current Assets |
249.71 |
37.46 |
44.02 |
105.37 |
|
Total Non-Current Assets |
6,181.92 |
7,321.16 |
6,524.36 |
6,208.94 |
|
|
|
|
|
|
|
Current Assets: |
|
|
|
|
|
Inventories |
2,709.78 |
2,762.00 |
3,145.29 |
3,432.83 |
|
Financial Assets: |
|
|
|
|
|
Investments |
1,719.87 |
1,873.19 |
2,847.32 |
2,588.19 |
|
Trade Receivables |
2,915.65 |
2,750.03 |
3,319.59 |
2,971.86 |
|
Cash and Cash Equivalents |
442.29 |
611.77 |
770.75 |
1,860.73 |
|
Other Bank Balances |
23.14 |
24.15 |
170.07 |
18.47 |
|
Loans |
6.41 |
10.01 |
10.10 |
14.22 |
|
Other Financial Assets |
68.97 |
57.74 |
4.12 |
82.56 |
|
Other Current Assets |
404.23 |
395.11 |
341.05 |
207.45 |
|
Total Current Assets |
8,290.34 |
8,484.00 |
10,608.29 |
11,176.31 |
|
|
|
|
|
|
|
Total Assets |
14,472.26 |
15,805.16 |
17,132.65 |
17,385.25 |
|
|
|
|
|
|
|
EQUITY AND LIABILITIES |
|
|
|
|
|
Equity: |
|
|
|
|
|
Equity Share Capital |
139.87 |
139.87 |
139.87 |
138.39 |
|
Other Equity |
7,610.86 |
8,397.81 |
9,757.24 |
10,701.30 |
|
Total Equity |
7,750.73 |
8,537.68 |
9,897.11 |
10,839.69 |
|
|
|
|
|
|
|
Liabilities |
|
|
|
|
|
Non-Current Liabilities: |
|
|
|
|
|
Financial Liabilities: |
|
|
|
|
|
Borrowings |
973.80 |
660.21 |
350.53 |
138.40 |
|
Lease Liabilities |
- |
59.15 |
135.13 |
205.87 |
|
Other Financial Liabilities |
16.98 |
31.11 |
23.93 |
29.99 |
|
Provisions |
68.91 |
152.08 |
136.73 |
64.76 |
|
Deferred Tax Liabilities |
634.61 |
562.74 |
552.24 |
553.83 |
|
Other Non-Current Liabilities |
14.83 |
13.44 |
11.53 |
10.56 |
|
Total Non-Current Liabilities |
1,709.13 |
1,478.73 |
1,210.09 |
1,003.41 |
|
|
|
|
|
|
|
Current Liabilities: |
|
|
|
|
|
Financial Liabilities: |
|
|
|
|
|
Borrowings |
2,007.60 |
2,452.92 |
2,926.52 |
2,976.64 |
|
Lease Liabilities |
- |
43.91 |
47.13 |
44.45 |
|
Trade Payables: |
|
|
|
|
|
Total Outstanding Dues of Micro and Small Enterprises |
58.08 |
96.46 |
355.98 |
310.02 |
|
Other Creditors |
1,693.15 |
2,043.65 |
2,120.01 |
1,629.64 |
|
Other Financial Liabilities |
921.30 |
901.72 |
206.81 |
198.76 |
|
Other Current Liabilities |
111.66 |
72.46 |
148.26 |
125.81 |
|
Provisions |
101.99 |
117.95 |
134.89 |
141.67 |
|
Current Tax Liabilities |
118.62 |
59.68 |
85.85 |
115.16 |
|
Total Current Liabilities |
5,012.40 |
5,788.75 |
6,025.45 |
5,542.15 |
|
- |
- |
- |
- |
|
|
Total Equity & Liabilities |
14,472.26 |
15,805.16 |
17,132.65 |
17,385.25 |
Suprajit Engineering Limited - Cash Flow Statement (₹ in Millions)
|
|
Mar-19 |
Mar-20 |
Mar-21 |
Mar-22 |
|
|
Net Profit Before Tax |
2,052.21 |
1,328.63 |
1,943.38 |
2,351.63 |
|
|
Net Cash from Operating Activities |
1,447.51 |
2,320.31 |
1,610.15 |
1,815.81 |
|
|
Net Cash Used for Investing Activities |
-890.20 |
-1,565.35 |
-598.24 |
365.00 |
|
|
Net Cash From (Used For) Financing Activities |
-417.77 |
-606.75 |
-860.23 |
-1,114.87 |
|
|
Net Increase in Cash and Cash Equivalents |
139.54 |
148.21 |
151.68 |
1,065.94 |
|
|
Cash And Cash Equivalents at The Beginning of The Year |
301.47 |
442.29 |
611.77 |
770.75 |
|
|
Cash And Cash Equivalents at The End of the Year |
442.29 |
611.77 |
770.75 |
1,860.73 |
|
Suprajit Engineering Limited - Ratio Analysis
|
|
Mar-19 |
Mar-20 |
Mar-21 |
Mar-22 |
|
Profitability Ratio |
|
|
|
|
|
Gross Profit |
44.85% |
42.88% |
43.86% |
43.38% |
|
EBITDA Margin |
17.03% |
15.43% |
16.47% |
16.11% |
|
EBIT Margin |
14.45% |
11.71% |
13.01% |
12.93% |
|
Pre-Tax Margin |
12.91% |
10.26% |
11.84% |
12.14% |
|
Net Profit Margin |
8.42% |
6.65% |
8.70% |
9.40% |
|
|
|
|
|
|
|
Return on Investment |
|
|
|
|
|
Return on Asset – ROA |
10% |
7% |
9% |
10% |
|
Return on Capital Employed – ROCE |
26% |
19% |
20% |
21% |
|
Return on Equity – ROE |
19% |
13% |
15% |
17% |
|
|
|
|
|
|
|
Liquidity Ratio |
|
|
|
|
|
Current ratio |
1.65 |
1.47 |
1.76 |
2.02 |
|
Quick Ratio |
1.11 |
0.99 |
1.24 |
1.40 |
|
|
|
|
|
|
|
Turnover Ratio |
|
|
|
|
|
Receivables Turnover |
5.5 |
5.5 |
5.4 |
6.8 |
|
Inventory Turnover |
3.6 |
3.3 |
3.2 |
3.3 |
|
Payables Turnover |
5.3 |
4.9 |
4.6 |
5.8 |
|
Asset Turnover |
1.2 |
1.0 |
1.0 |
1.1 |
|
|
|
|
|
|
|
Solvency Ratio |
|
|
|
|
|
Debt to Equity |
0.13 |
0.08 |
0.04 |
0.01 |
|
Interest Coverage Ratio |
9 |
8 |
11 |
16 |
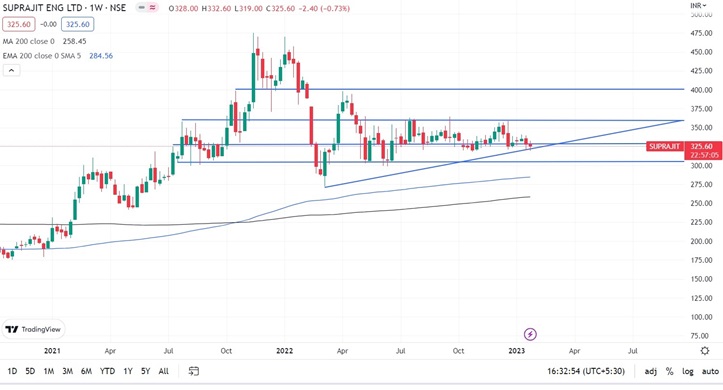
Suprajit Engineering Limited - Technical Analysis
-
Stock is trading above Moving Average 200 Days with a support level of ₹301 and a resistance level of ₹400
-
One can accumulate this stock at current levels.
CONCALL
-
Domestic Cable Division (DCB), a corporation, performed well in both the OEM and aftermarket markets. The business was able to pass on the material expenses, although as usual there was a slight delay.
-
At all of the plants, operational efficiency is closely monitored using DTA measures Management initiatives to move toward semi-automation or autonomy are progressing well.
-
Unit 8 Bommasandra, the company's one-stop shop for aftermarket needs, is expected to be complete by the end of the current fiscal year and open to the public early in the next one.
-
The most important development for Suprajit Europe and SAL, or the European cable operations, is that the company received a successful pricing rise from all the main clients, including all the OEMs.
-
Even though conditions in Europe and the US are getting worse, LDC has improved its performance significantly. Along with the team integration effort, which has successfully identified and begun delivering on many synergies and improvements as well as cost savings across LDC, SENA, and SAL plants, the plant management teams have worked hard to provide operational improvements. In comparison to the prior forecast of 95 million and in the range of 5% to 7%, management is decreasing full-year projected revenues from LDC. This is mostly caused by some of the global currency implications.
Suprajit Engineering Limited - Recommendation Rationale
-
Dominant Position in Mechanical Control Cables and Lamps.
-
In terms of suppliers for mechanical control cables, Suprajit ranks second internationally and first in India. The business is also the biggest provider of lamps in India and the third-largest supplier worldwide.
-
Due to the firm's strong market position, competitive pricing against competitors is supported, with increased operational leverage and reduced raw material costs as the main drivers.
-
-
Expanding Global Presence & Investment in Research and Development:
-
Wherever its key clients have grown, Suprajit has dependably made sure that its manufacturing presence is there as well. In Pantnagar, Haridwar, and Sanand, respectively, the business established facilities for Bajaj Auto, Hero MotoCorp, and Tata Motors/Honda 2W, all of which have benefited from solid client connections. Furthermore, Suprajit established separate Honda 2W factories in Gujarat and Karnataka, which helped the company increase its market share from 40% to 70% over the previous several years. Additionally, the business has export-specific facilities (SEZ, EOU, and DTA) for its international clients.
-
Suprajit has boosted its R&D spending, helped by a robust balance sheet. The business set up a special facility last year. This center, along with its US/UK centres, has more than 15 patents and employs roughly 70 engineers who are heavily focused on developing new technologies.
-
-
Acquisition of New Brands:
-
Suprajit's client base has grown as a result of the company's purchases of Wescon, Kongsberg LDC, Phoenix, Luxlite, Trifa, Shah Concabs, and CTP Gills, among other brands. Suprajit has also been able to gain a stronger foothold among new clients because of its aggressive pricing strategy and worldwide production capabilities.
-
The business has also established an export-oriented unit (EOU) that can adhere to international standards and fulfill the quality demands of consumers from other countries.
-
-
Strong Client Base:
-
The company has a strong client base which includes Reputable 2W OEMs including Bajaj Auto Limited (BAL), Hero MotoCorp Limited, TVS Motor Company Limited, and Honda Motorcycle & Scooter India (HMSI), among others, are included in SEL's customer list.
-
-
Increase in Export:
-
Direct cable exports from India are made by Suprajit, mostly to destinations in Europe. The business has a full order book from clients like BMW and VW. In FY22, Suprajit's exports of auto cables were Rs2 billion. Over the next two to three years, management anticipates excellent revenue CAGR of 20%, underpinned by a robust order pipeline.
-
Suprajit Engineering Limited - Valuation
-
Suprajit Engineering Limited has shown revenue growth of 6% CAGR for FY2018-2022.
-
The company’s net profit has shown a growth of 5% CAGR for FY2018-2022.
-
The company’s ROE and ROCE are 17% & 21% for FY2022.
-
The company has reduced its debt over the last past 4 years.
-
We anticipate the company could generate higher revenue for the following FY 2023, comparable to the prior year, based on the company's present performance in FY 2022.
-
We used data from the last five years (2018-2022) to anticipate revenue for the fiscal years 2023–2027.
Suprajit Engineering Limited - Estimated Income Statement (₹ in Millions)
|
|
Mar-23 |
Mar-24 |
Mar-25 |
Mar-26 |
Mar-27 |
|
|
2023-E |
2024-E |
2025-E |
2026-E |
2027-E |
|
Revenue |
19,946.96 |
20,994.14 |
22,097.24 |
23,259.31 |
24,483.61 |
|
COGS |
11,413.20 |
12,001.19 |
12,619.48 |
13,269.62 |
13,953.25 |
|
Gross Profit |
8,533.76 |
8,992.95 |
9,477.76 |
9,989.69 |
10,530.36 |
|
Employee Expenses |
3,622.28 |
3,808.89 |
4,005.12 |
4,211.46 |
4,428.43 |
|
Other Expenses |
1,718.65 |
1,807.20 |
1,900.30 |
1,998.20 |
2,101.15 |
|
EBITDA |
3,192.83 |
3,376.86 |
3,572.33 |
3,780.02 |
4,000.78 |
|
Depreciation |
610.52 |
612.15 |
618.19 |
628.23 |
641.95 |
|
EBIT |
2,582.31 |
2,764.71 |
2,954.14 |
3,151.79 |
3,358.83 |
|
Financial Cost |
157.55 |
168.68 |
180.23 |
192.29 |
204.92 |
|
EBT |
2,424.76 |
2,596.03 |
2,773.91 |
2,959.50 |
3,153.91 |
|
Tax expenses |
606.19 |
649.01 |
693.48 |
739.87 |
788.48 |
|
PAT |
1,818.57 |
1,947.03 |
2,080.43 |
2,219.62 |
2,365.43 |
Disclaimer: This report is only for the information of our customer Recommendations, opinions, or suggestions are given with the understanding that readers acting on this information assume all risks involved. The information provided herein is not to be construed as an offer to buy or sell securities of any kind.
- Share :


Post a Comment
|
DISCLAIMER |
This report is only for the information of our customers. Recommendations, opinions, or suggestions are given with the understanding that readers acting on this information assume all risks involved. The information provided herein is not to be construed as an offer to buy or sell securities of any kind. ATS and/or its group companies do not as assume any responsibility or liability resulting from the use of such information.