SPICEJET
|
Industry |
CMP |
Recommendation |
Target |
Time Horizon |
|
Aviation |
130 |
Buy at CMP |
180- 210 |
1 - 1.5 year |
SpiceJet is the 3rd largest low-cost carrier airline in India .Promoted and managed by founder and Industry veteran Mr. Ajay Singh, the company is engaged in the business of scheduled air transport services and cargo logistics.
|
|
|
|
CMP as on 18/7/2017 |
427.10 |
|
52 Week High/Low |
446/288 |
|
Market Cap (Cr) |
7526 |
|
Total Debt (FY-17)(Cr) |
1028 |
|
Enterprise Value(FY-17)(Cr) |
8446 |
|
Cash and Investment (FY-17)(Cr) |
108 |
|
Equity Capital (Cr) |
599.45 |
|
Face Value |
10 |
|
Share Holding Pattern |
|
|
Promoters&Promoters Group Holding (%) |
60.25 |
|
Public Holding (%) |
39.75 |
|
Grand Total |
100 |
-
UDAN Scheme and the advantage of first mover.
-
Air passenger traffic growth and highest passenger load factor.
-
Aggressive expansion plans- order of $22- billion for Boeing planes.
-
Strengthening rupee, as well as lower crude oil prices.
-
Emphasis on operating efficiency.
SpiceJet - Business Overview:
-
Flights per day: 364
-
Domestic destinations : 39
-
International destinations: 7
Fleet Size and Division: Total fleet size is 50, which contains
-
Boeing 737-900 - total 4 are in service, each has capacity of 212 seats
-
Boeing 737-800 - total 27 are in service, each has capacity of 189 seats
-
Bombardier Q-400 - total 19 are in service, each has capacity of 78 seats
SpiceMax: Is a premium service offered by SpiceJet to enhance the passenger convenience. SpiceMax seats are wider and roomier. SpiceJet is looking for additional revenue by giving premium service with little operational cost.
International Destinations: Afghanistan, Maldives, Nepal, Oman, Saudi Arabia, Sri Lanka and the UAE.
Future Prospects: Recently SpiceJet has placed biggest order in the history of Indian aircraft of 205 aircrafts worth $22 billion.
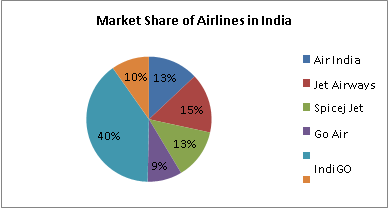
SpiceJet - Industry Overview:
There are a total of 22 airlines which are operational in India as of 2015. There are 6 major airlines as follows,
-
IndiGo
-
Jet Airways
-
SpiceJet
-
Air India
-
GoAir
-
JetLite
Listed Airlines are,
Total commercial fleet size is 496 aircraft (as of March 2017), with orders for more than 650 in the pipeline.
Investment Rationale:
-
UDAN Scheme and Advantage of first mover:
SpiceJet is one of the early movers who have launched 3 flights under UDAN scheme. SpiceJet has been awarded 6 proposals and 11 routes under UDAN scheme. It has also reserved 3 years exclusivity on those routes which makes it the only airline to operate on these routes. SpiceJet is currently the largest player in the country under the regional connectivity scheme. Moreover, SpiceJet is equipped with smaller Bombardier Q-400 which are more efficient for regional connectivity scheme because traffic expected under UDAN scheme would not be robust initially making it more suitable than Indigo who has Airbus A320 aircraft. Because of this SpiceJet has witnessed 90% overall capacity utilization on the flights operating under the scheme.
-
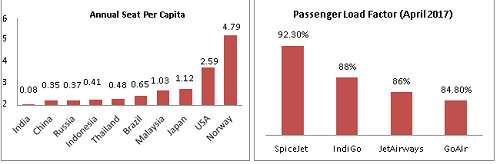
Air passenger traffic growth and highest passenger load factor:
India is the fastest growing domestic aviation market in the world. Growing economy, rising income level, implementation of 7th pay commission all these opportunities are favorable for aviation sector to thrive in India. India is one of the least penetrated air markets in the world. Only about 2% of the population currently travels by air while for US it is around 40%. With only 0.04 trips per capita per annum as compared to 0.3 in China and more than 2% in US , Indian market offers lots of opportunity in the future for the dominant players like SpiceJet to explore the Indian market.
-
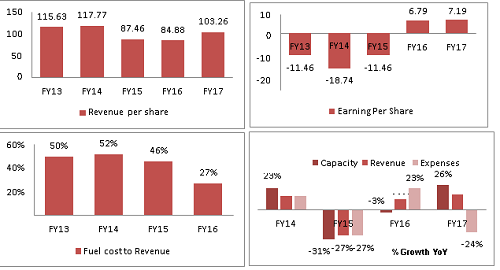
Passenger Load Factor (PLF)
PLF which measures the capacity utilization is 92.3% for SpiceJet which is far better than IndiGo (88%) and Jet Airways (86%), which indicates SpiceJet has better utilization and lower operating cost.
-
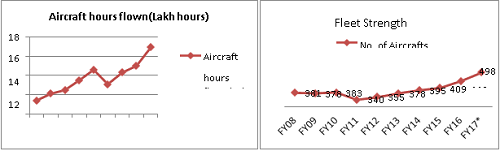
Aggressive expansion plans- order of $22-billion for Boeing planes :
SpiceJet has placed order for 20 Boeing 737 MAX 10 planes in June 2017 and agreed to acquire 100 new which will enable SpiceJet to benefit from economies of scale by reducing cost and increasing passenger carrying capacity. SpiceJet has current fleet size of 50 planes. By 2rd quarter of FY 18 it will take delivery of first few Jets. SpiceJet has ruled out the option of debt or issuing equity for funding which could help in enhancing shareholders wealth. By next year SpiceJet will double its fleet.
-
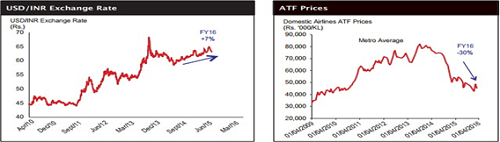
Strengthening rupee, as well as lower and stable crude oil prices:
Airlines 30-40% cost is expend on ATF (Air Turbine Fuel). Brent prices are down from $ 115 in 2014 to $50 in 2017, which is one of the main reasons of Indian airlines turning into profit. Though oil prices have rebounded from low $37 to around $50, it is settling around it which will stabilize the fuel cost for Aviation sector.
Addition to the low fuel prices, strengthening in the rupee helping the airline companies like spice jet to reduce cost of import as well as finance cost. Rupee has appreciated from high of 69 in 2016 to 63.4 in August 2017 against dollar i.e.8% decrease. With more investment in Indian market by foreign entities and stable Indian economy could extend the strengthening of Rupee against Dollar or at least resist the depreciation.
-
Emphasis on operating efficiency:
Company ended financial year 2015-16 with positive cash reserves, means it has paid all the obligations. Now with availability of cash dependency on working capital has reduced drastically. SpiceJet is focusing on optimization of routes discarding inefficient destinations and utilizing it for more profitable routes. SpiceJet has achieved Industry best aircraft utilization of around 12 hours a Aircraft a day.
Expenditure on aircraft fuel dropped to 42% in FY16 from FY15. Other operational expenses have decreased by 26%. Finance cost has dropped by 29% in Fy16.
Valuation Ratios
FY16
FY15
FY14
FY13
FY12
Enterprise Value (Cr.)
4753.72
2695.68
2268.65
2751.82
1659.14
EV/Net Operating Revenue(X)
0.93
0.52
0.36
0.49
0.42
EV/EBITDA (X)
8.48
-5.64
-3
-79.83
-3.18
MarketCap/Net Operating Revenue (X)
0.75
0.25
0.12
0.23
0.26
Price/BV (X)
-6.07
-1.03
-0.74
-5.75
-6.79
Price/Net Operating Revenue
0.75
0.25
0.12
0.23
0.26
Earnings Yield
0.11
-0.53
-1.32
-0.15
-0.58
Financials consolidated FY17:
Income Statement:
|
Income |
Mar '12 |
Mar '13 |
Mar '14 |
Mar '15 |
Mar '16 |
|
Sales Turnover |
3943.26 |
5600.68 |
6304.23 |
5201.53 |
5088.07 |
|
Net Sales |
3943.26 |
5600.68 |
6304.23 |
5201.53 |
5088.07 |
|
Other Income |
75.85 |
204.46 |
94.36 |
241.67 |
192.36 |
|
Total Income |
4019.11 |
5805.14 |
6398.59 |
5443.2 |
5280.43 |
|
Expenditure |
|||||
|
Raw Materials |
48.33 |
66.39 |
92.94 |
72.13 |
62.69 |
|
Power & Fuel Cost |
39.53 |
2806.71 |
3255.79 |
2412.58 |
1395.55 |
|
Employee Cost |
402.87 |
526.8 |
575.7 |
537.47 |
492.84 |
|
Other Manufacturing Expenses |
2773.74 |
808.31 |
1184.94 |
1125.6 |
1125.26 |
|
Miscellaneous Expenses |
1277.16 |
1588.74 |
2046.06 |
1711.98 |
1579.58 |
|
Total Expenses |
4541.63 |
5796.95 |
7155.43 |
5859.76 |
4655.92 |
|
Operating Profit |
-598.37 |
-196.27 |
-851.2 |
-658.23 |
432.15 |
|
PBDIT |
-522.52 |
8.19 |
-756.84 |
-416.56 |
624.51 |
|
Interest |
52.26 |
115.72 |
98.16 |
143.86 |
99.73 |
|
PBDT |
-574.78 |
-107.53 |
-855 |
-560.42 |
524.78 |
|
Depreciation |
31 |
83.55 |
148.26 |
126.63 |
117.59 |
|
Profit Before Tax |
-605.78 |
-191.08 |
-1003.26 |
-687.05 |
407.19 |
|
PBT (Post Extra-ord Items) |
-605.78 |
-191.08 |
-1003.26 |
-687.05 |
407.19 |
|
Reported Net Profit |
-605.77 |
-191.08 |
-1003.24 |
-687.05 |
407.2 |
|
Total Value Addition |
4493.3 |
5730.56 |
7062.48 |
5787.63 |
4593.23 |
|
Earnings Per Share (Rs) |
-13.72 |
-3.95 |
-18.74 |
-11.46 |
6.79 |
|
Book Value (Rs) |
-3.34 |
-4.91 |
-19.67 |
-26.94 |
-20.2 |
Balance Sheet:
|
Balance Sheet |
Mar '12 |
Mar '13 |
Mar '14 |
Mar '15 |
Mar '16 |
|
Source of Funds |
|||||
|
Total Share Capital |
441.45 |
484.35 |
535.28 |
599.45 |
599.45 |
|
Equity Share Capital |
441.45 |
484.35 |
535.28 |
599.45 |
599.45 |
|
Share Application Money |
0 |
13.57 |
33.3 |
350.5 |
579.09 |
|
Reserves |
-588.68 |
-722.36 |
-1588.06 |
-2214.47 |
-1810.16 |
|
Networth |
-147.23 |
-224.44 |
-1019.48 |
-1264.52 |
-631.62 |
|
Secured Loans |
88.65 |
71.76 |
1236.28 |
1119.87 |
923.73 |
|
Unsecured Loans |
766.79 |
1606.36 |
280 |
298.59 |
105 |
|
Total Debt |
855.44 |
1678.12 |
1516.28 |
1418.46 |
1028.73 |
|
Total Liabilities |
708.21 |
1453.68 |
496.8 |
153.94 |
397.11 |
|
Application of Funds |
|||||
|
Gross Block |
906.1 |
1931.43 |
2154.69 |
2091.8 |
2072.04 |
|
Less: Accum. Depreciation |
55.89 |
137.91 |
278.02 |
377.98 |
469.95 |
|
Net Block |
850.21 |
1793.52 |
1876.67 |
1713.82 |
1602.09 |
|
Capital Work in Progress |
0.06 |
1.21 |
0.77 |
0 |
0 |
|
Investments |
0 |
0 |
0 |
0 |
20 |
|
Inventories |
31.65 |
45.62 |
45.15 |
45.12 |
66.55 |
|
Sundry Debtors |
20.41 |
105.03 |
155.74 |
121.68 |
43.37 |
|
Cash and Bank Balance |
235.91 |
217.08 |
5.06 |
23.58 |
108.49 |
|
Total Current Assets |
287.97 |
367.73 |
205.95 |
190.38 |
218.41 |
|
Loans and Advances |
832.1 |
908.55 |
851.09 |
702.39 |
863.29 |
|
Total CA, Loans & Advances |
1120.07 |
1276.28 |
1057.04 |
892.77 |
1081.7 |
|
Current Liabilities |
1247.1 |
1600.25 |
2415.99 |
2102.07 |
1656.07 |
|
Provisions |
15.04 |
17.1 |
21.67 |
350.58 |
650.62 |
|
Total CL & Provisions |
1262.14 |
1617.35 |
2437.66 |
2452.65 |
2306.69 |
|
Net Current Assets |
-142.07 |
-341.07 |
-1380.62 |
-1559.88 |
-1224.99 |
|
Total Assets |
708.2 |
1453.66 |
496.82 |
153.94 |
397.1 |
- Share :


Post a Comment
|
DISCLAIMER |
This report is only for the information of our customers. Recommendations, opinions, or suggestions are given with the understanding that readers acting on this information assume all risks involved. The information provided herein is not to be construed as an offer to buy or sell securities of any kind. ATS and/or its group companies do not as assume any responsibility or liability resulting from the use of such information.