Specialty Chemicals Industry Research Report
Global Specialty Chemicals Industry
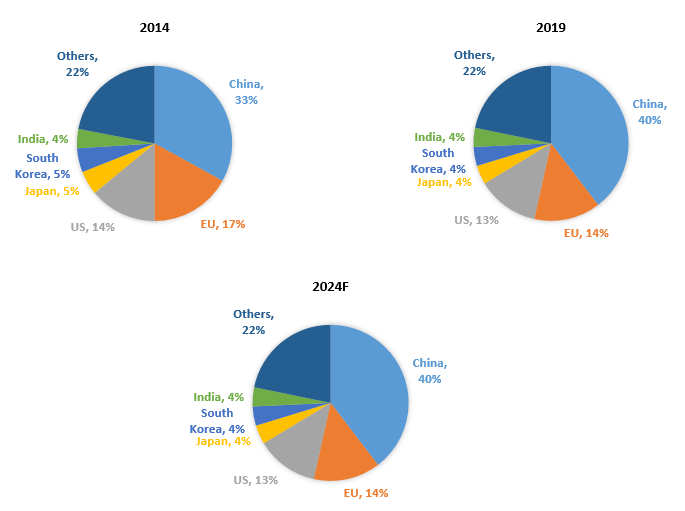
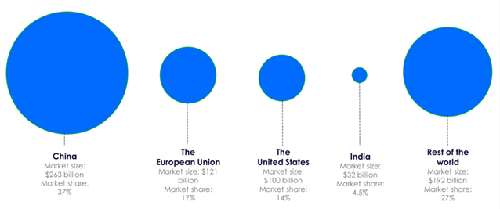
The Chemical Industry is one of the most ubiquitous industries in manufacturing, as the products find their application across different sectors. The global chemicals market was valued at around USD 4,738 billion as of FY19. China accounts for a major share (37%) in the chemicals segment followed by the European Union and the US with a market share percentage of 17% and 14% respectively. In the global chemicals market, India has a 3.5% market share. The market is expected to grow at a CAGR of 6.2% and reach USD 6,400 billion by 2024. In the coming years, the contribution of Asia-Pacific (APAC) towards the chemicals sector is expected to increase and it is estimated to grow at a CAGR of 7-8% during the forecast period (2019-2024F). When compared to the APAC, the other chemicals markets are mature and hence they would record a slower growth rate of 3-4%.
The key segments of the chemical industry are Commodity chemicals and Specialty chemicals. The global chemical industry is made up of 80% commodity chemicals and 20% specialty chemicals. Commodity chemicals are also known as common chemicals or bulk chemicals. These chemicals are manufactured by a number of companies in bulk quantities and are developed in a very standardized form. Product differentiation does not exist and all the products are identical from an application point of view. The products under commodity chemicals are plastics, synthetic fibers, synthetic rubber, dyes, pigments, paints etc., Specialty chemicals are the products that are not provided by a large number of companies and extensive product research and development goes behind these chemicals. The specialization of the products brings better margins and profitability to the specialty chemical players.
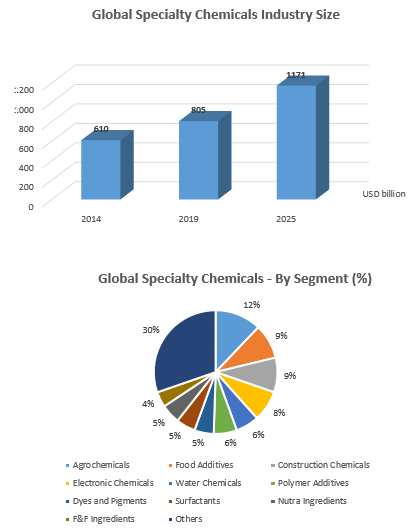
Global specialty chemicals industry grew at a CAGR of 5.7% over the last 5 years and in 2019, it was valued at USD 805 billion. Over the next five years, it is projected that the industry would reach USD 1.2 trillion by 2025 at a CAGR 6.4% between 2019 and 2025. In the past couple of decades, a major shift in the manufacturing of chemicals from North America and EU to Asia was seen, particularly in the specialty chemicals space. As strong growth is seen in end-user industries in emerging countries like China and India, it is estimated that the specialty chemicals industry would register faster growth in these economies. China’s share in the global chemicals market increased from 6% in 2000 to approximately 36% in 2019.
Over the last couple of decades, Asian markets benefitted from a paradigm shift in the market dynamics of international trade. Manufacturing activity and consumption growth were high in the Asian markets, and this made Asia become a net exporter for a wide range of specialty chemicals. Asian countries dominated erstwhile leading exporting markets - EU and North America in terms of exports. Globally, the total specialty chemicals export market is valued at around USD 200 billion. China cemented its position as the leading supplier of specialty chemicals to countries across the globe. Large-scale manufacturing, rapid industrialization and low costs of manufacturing made China become a dominant supplier for various chemical intermediates.
Indian Specialty Chemicals Sector
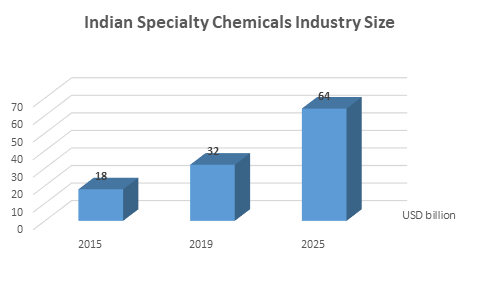
chemical industry in India was valued at USD 180 billion in 2019 while the specialty chemicals segment was valued at USD 32 billion in 2019. Specialty chemicals segment constitutes about 18% of the Indian chemicals industry. Indian specialty chemicals industry is consistently growing at a rapid rate when compared to the overall chemicals industry, at a CAGR of 11% in the period 2014-2019. An increase in end-user segments’ demand and strong export growth drove the growth rate.
Specialty chemical industry in India is highly fragmented, as most sub-segments have only few scaled up players. Scale of operations is the key differentiating factor across the segments that can help a company in gaining considerable market share and achieve economies of scale. UPL is the only Indian company that has a revenue of over USD 1 billion and a global manufacturing network. The industry has a large number of unorganized players amounting to a considerable size of the market. In some sub-segments such as F&F Base ingredients, the unorganized players have a larger share than the organized players. The players in the unorganized market largely cater to the needs of smaller/unorganized customers in their respective end-user segments. Organized players have access to resources, hence they have their presence in segments that need R&D like agrochemicals, nutraceuticals, and construction chemicals and so on. In these sub-segments, unorganized players have a very small presence.
Organized players have a market share of ~70% while unorganized players have a share of ~30% in the Indian specialty chemicals industry. Of all the states in India, Gujarat and Maharashtra were the most preferred manufacturing destinations for specialty chemical players. This can be understood from the statistic that 15 companies out of the top 25 specialty chemical companies have their manufacturing facilities in either of these states. Some of the factors that made the companies favor these states are: a) excellent connectivity to the West by way of ports, b) availability of skilled manpower, c) business-friendly policies and d) better infrastructure facilities. However, the manufacturing activity is expected to increase on the east coast as well, as the Indian government announced Petroleum, Chemical and Petrochemical Investment Regions (PCPIRs) in the states of Gujarat, Andhra Pradesh and Tamil Nadu. India’s eastern coast opens to the markets of South-East Asia, thereby expanding the export markets.
Key Characteristics of the Indian Specialty Chemicals Industry
-
Strong export presence: Factors like availability of skilled human resources, low-cost manufacturing capabilities and strong process engineering skills made India a favorable manufacturing destination for players across the globe. Export-oriented business is growing at a rapid pace than domestic business. Indian players’ strong reputation amongst the consumers across the globe, environmental standards and high product standards make India a strong player.
-
Strong growth potential in domestic market: Growing per capita income aided by end-user segments’ growth and rapid urbanization boost domestic demand for specialty chemicals.
-
Lower focus on R&D activities: Even large Indian players spend only 3% of their revenue towards R&D, whereas the global players spend around 6-10% of the revenue. Indian markets are generic in nature.
-
Increasing businesses’ focus on sustainable chemistry: Sustainable chemistry is gaining importance in India. Indian government and other stakeholders are actively taking steps towards the adoption of green methods to produce chemicals.
Overview of various segments in the Indian Specialty Chemicals Industry
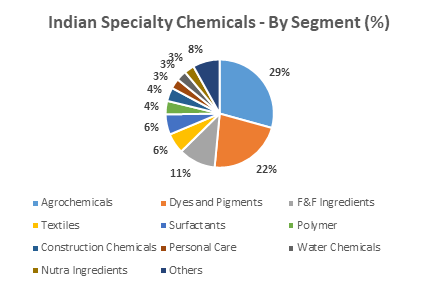
Indian specialty chemicals industry is evolving based according to the requirements of domestic end-users and global users. The largest constituent of this diverse industry is agrochemicals, which forms 29% of the total value of Indian specialty chemicals industry. The other sub-segments that command good portion of this industry are Dyes & Pigments (22%), Flavor & Fragrance (Functional & Base) ingredients (11%), Textiles (6%), and Surfactants (6%). In the coming years, industry players expect sub-segments that cater to the end-user industries like pharmaceuticals, healthcare, and FMCG products, fuel growth rather than intermediary industries like agrochemicals.
|
S.No. |
Sub-segment |
2014 (USD bn) |
2019 (USD bn) |
2025 (USD bn)* |
CAGR (2019-25)* |
|
1 |
Agrochemicals |
5.7 |
9.2 |
18.1 |
12% |
|
2 |
F&F: Ingredients |
0.7 |
1.4 |
0.07 |
15% |
|
3 |
Nutraceuticals |
0.4 |
1 |
3 |
20% |
|
4 |
Dyes and Pigments |
4.9 |
7 |
12.3 |
10% |
|
5 |
Personal Care Chemicals |
0.5 |
1 |
2.4 |
15% |
|
6 |
Surfactants |
1.5 |
2 |
3.8 |
11% |
|
7 |
Textile Chemicals |
1.1 |
1.8 |
3.8 |
11.5% |
|
8 |
Construction Chemicals |
0.7 |
1.4 |
3.1 |
15% |
|
9 |
Polymer Additives |
0.7 |
1.3 |
2.3 |
10% |
|
10 |
Water Chemicals |
0.4 |
0.8 |
1.9 |
15% |
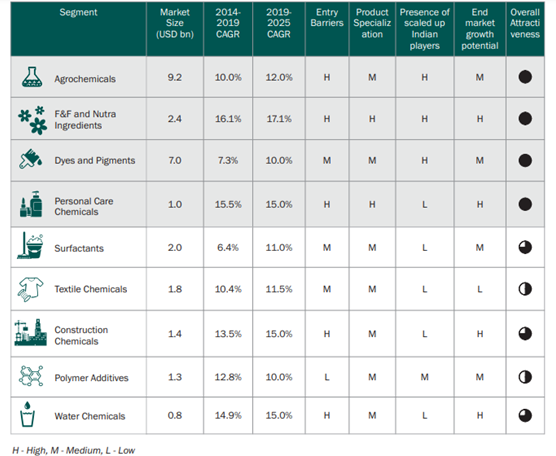
While the entire specialty chemicals industry is highly attractive, specific sub-segments of the industry stand out in terms of lucrative growth potential, scalability and presence of scaled up Indian players. The following table summarizes the overall attractiveness of the sub-segments based on parameters like entry barriers, product specialization, presence of scaled up Indian players and end market growth potential. Agrochemicals, F&F and nutraceutical ingredients, dyes & pigments, and personal care chemicals are the sub-segments that are particularly attractive when compared to the other segments.
1) Agrochemicals segment overview
Agriculture being the backbone of Indian economy, provides a source of livelihood to over half of the Indian population, and contributes 16% towards Indian economy. Agricultural products hold a 12% share in India’s exports. Agrochemicals played a key role in improving agricultural productivity in India. As of 2019 data, India is the 4th largest manufacturer and 5th largest exporter of agrochemicals in India. India being one of the fastest growing markets for agrochemicals, there is massive room for growth, as the consumption of agrochemicals in India is still very low. On a per hectare basis, the US and UK consume ~10X the agrochemicals usage in India, whereas countries like Japan and China consume ~20X. Crop yield in India losses are around 15 to 20%, caused by weeds, pests, rodents and insects. This loss can be minimized with the usage of agrochemicals.
In 2019, Indian agrochemicals segment value stood at USD 9.2 billion, while the export market stood at USD 4.14 billion. In the period 2014-19, Indian agrochemicals segment grew at a CAGR of 10% and it is projected to grow at a CAGR of 12% to reach a valuation of USD 18.1 billion by 2025. Insecticides lead the segment with a share of 54%. The sales mix is expected to change with the shortage of labor. Herbicides and fungicides are projected at a higher rate when compared to insecticides in the segment. Maharashtra is the largest consumer of agrochemicals with a share of 25%. Indian agrochemical players have less focus on R&D, as they spend less than 2% of their revenue towards R&D. Global majors spend around 6-10% of their revenues. Indian agrochemicals segment is mostly generic in nature.
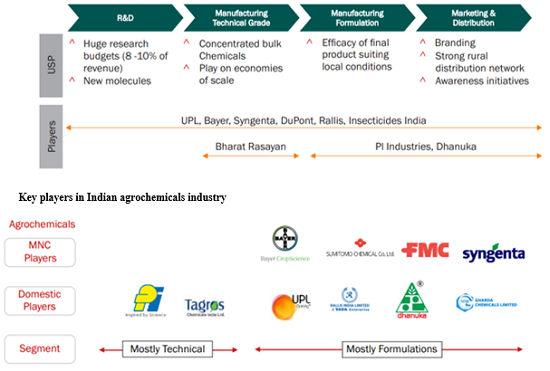
Agrochemicals Value Chain
R&D of agrochemicals product involves a significant amount of time and capital investment. Hence most companies do not involve themselves in the development of products. Only a few players invest their resources in R&D in the agrochemicals value chain. Technical grade manufacturers produce active ingredients, which are later used by formulators to manufacture formulations that are eventually used by the farmers. Dealers and distributors play a crucial role in the distribution of the products and thereby differentiating the company from other players.
Growth Drivers
-
India’s farm productivity yield is significantly low when compared to countries like US and China. Agrochemicals play a key role in improving farm productivity by preventing crop losses arising from weeds, pests, fungus etc.
-
Awareness among farmers regarding the usage of right crop care solutions is increasing. Thanks to the initiatives taken by the government to educate farmers and digitization. An increase in farmer incomes and availability of credit would encourage farmers to spend more towards the purchase of agrochemicals, to improve farm yield.
-
Policy reforms by the government, is likely to boost agricultural sector’s growth and also the incomes of a farmer, which in turn would increase the demand for agrochemicals.
-
India has become a strong exporter of generics for agrochemicals by exporting around 45% of the total production. Low-cost manufacturing capabilities and a strong pipeline of agrochemical products going-off patent are likely to create a huge growth opportunity for the industry.
2) F&F and Nutra Ingredients Overview
Ingredients are specialty chemicals that add functional properties to food, beverages, personal care products and pharmaceuticals. The properties can be flavors, fragrance or nutritional benefits. Ingredients of flavors, fragrances and nutraceuticals have different customer mixes and products bases, but in R&D, in the molecules and in some stages of production of these ingredients, there is a significant overlap. All the ingredients are often produced from the same starting blocks, referred to as base ingredients.
Broadly, the F&F and Nutraceutical industry has four key stakeholders.
-
Raw material suppliers - These products are obtained either a feedstock using a synthetic process or from natural products such as herbs, spices, fruits and flowers.
-
Base ingredient manufacturers – The base ingredients are chemicals used in the value chain and form the starting blocks.
-
Functional ingredient manufacturers – The base ingredients are further processed by these manufacturers into products that are later supplied to FMCG, F&B and nutraceutical sectors.
-
End-consumer industries
F&F and Nutraceuticals Value Chain
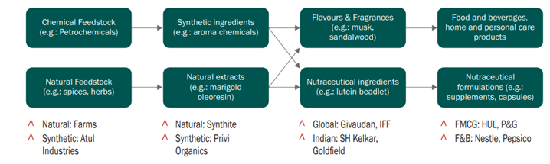
A) Base Ingredients
Base ingredients can be classified into two types based on their nature. They are natural base ingredients and synthetic base ingredients. Natural base ingredients are extracted from naturally available products like fruits, flowers, spices or herbs, whereas synthetic base ingredients are derivatives of other raw materials and the final ingredients are obtained after a series of chemical reactions. Natural base ingredients form about 70% of the total market, whereas the remaining share is held by synthetic base ingredients. Because of abundant availability of the requisite raw materials, India is a leading exporter of natural base ingredients and among the top three global suppliers of these ingredients.
Base ingredients market in India grew at a CAGR of 11.3% in the period 2014-19. The growth rate fell because of a shrink in the contribution of mint extract, because of a reduction in prices. The base ingredients segment is projected to grow at a CAGR of 12%, to USD 6.9 billion by 2025 by 2025.
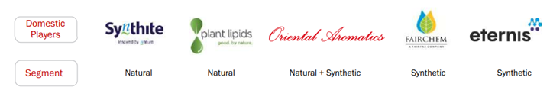
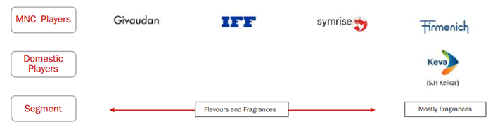
B) F&F Ingredients
Flavors and Fragrances are very crucial components of food & beverages, home and personal care products, as they have a strong influence on the purchasing decision and customer satisfaction. These ingredients connect with the customers on a sensorial level and contribute towards a positive or negative brand recall. The ingredients constitute a very small portion of the end-products cost, in the case of flavors – less than 2% and fragrances – 4 to 6%. This segment has entry barriers such as a high need for innovation, time and resources for R&D, and getting orders of large customers.
In 2019, Indian F&F market was valued at USD 1.4 billion, with exports contributing to 12% of the total production. Flavors & Fragrance segment is estimated to grow at a CAGR of 15%, to USD 3.3 billion by 2025. Top 5 players account for 65% of the share of the Indian market.
Key Players in Indian F&F Segment
C) Nutraceutical Ingredients
These ingredients are the active components that lend functional properties to the nutraceutical formulation. Nutraceutical ingredients can be manufactured either from natural bases or from synthetic bases. India has gradually become an emerging player in this segment. As the domestic market for these ingredients is very small, most of the production is being exported to US and Europe. In 2019, this segment stood at USD 1 billion, growing at a CAGR of 19% in the period 2014-19. The segment is projected to grow to USD 3 billion by 2025, by growing at a CAGR of 20% over the next 5 years. This segment is characterized by few large players and a large number of small players.
Key Players in Indian Nutraceutical Ingredients Segment

Growth Drivers
-
The demand for FMCG products in Indian rural markets is growing at a 3 to 5% higher growth rate than in urban markets. The overall FMCG market has been growing at ~14%. Growth in these products will create a demand for ingredients market.
-
Rising income levels of consumers have increased their appetite for premium products such as fragrances, beauty care etc., in the personal care segment.
-
Willingness to experiment new and unconventional flavors has resulted in the increase of demand for processed foods. This increases the demand for flavor ingredients.
-
Change in lifestyle makes it difficult for people to follow a balanced diet. Nutraceuticals are easy to carry and help consumers in addressing their nutritional needs, resulting in an increase in the demand for nutraceutical ingredients.
-
Consumer awareness is increasing about the presence of chemicals in medication and their side effects. Consumers are being more cautious in the aspects of fitness and appearance, and hence the demand for product categories such as hair loss control, vitamin deficiency and bone health is increasing.
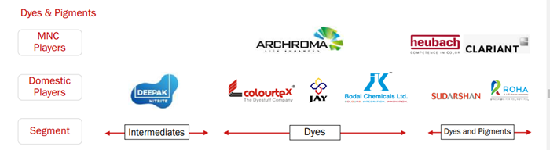
3) Dyes and Pigments Overview
The colorants industry has two key segments – Dyes and Pigments. Dyes are soluble in nature and pass color to the substrate to which these are applied, whereas pigments are insoluble and impart color to coating materials. Dyes are used in the textile and leather industry, while pigments are used in paints and coating, plastics and inks. The textile industry consumes almost 70% of the dyes, and paints and printing ink consume 50% of the pigments. The other leading consumers of pigments are plastic industry and textile industry. In India, in 2019, the market of dyes and pigments stood at USD 7 billion and grew at a CAGR of 7.3% in the period 2014-19. Dyes and Pigments market is estimated to reach USD 12.5 billion by 2025 at a CAGR of 10% over the period 2020-25. Dyes and dyestuffs constitute about 70% of the market, whereas the pigments account for the remaining 30%.
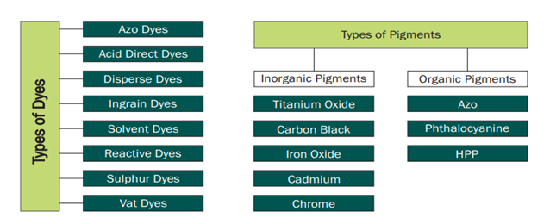
Types of Dyes and Pigments
Dyes are organic, they are derived from hydrocarbons whereas pigments can be organic as well as inorganic. Dyes are classified on the basis of their application or the way they are held in material. Reactive dyes account for majority of the market. Indian Pigment industry is dominated by organic pigments, because of dependency on imports for Titanium Oxide (largest pigment category), whereas the global industry is dominated by inorganic pigments.
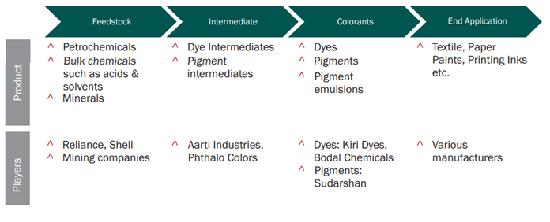
Dyes and Pigments Value Chain
Players either act as either pure-play dye manufacturers or pure-play pigment manufacturers. The reason for that lies in the manufacturing process, as the process is significantly different from the other. The feedstock range from petrochemicals to even minerals, based on the type of dyes and pigments manufactured. Large scale players have an integrated setup, they sell the products for final end-use.
Growth Drivers
-
In India, there is a growing demand for textiles, paints and plastics. The textile industry is the largest consumer in the dyes and pigments industry, followed by paints and plastics. Factors like growing consumerism and increasing demand for high-end products are likely to influence the growth of this industry.
-
The environmental crackdown initiated by China two years ago hurt the dyes and pigments industry, the most. This event resulted in the realignment of global supply chain and India has banked on this, as a reliable player among the global players.
Key Players in Indian Dyes and Pigments Segment
4) Personal Care Chemicals Overview
The usage of personal care products in daily life such as skin care, hair care, oral care is increasing and the chemicals that are used in the manufacturing of these products are largely undifferentiated bulk chemicals such as wax, solvents etc., Based on their reactive capability, the chemical ingredients are classified into active and inactive ingredients. Active ingredients are responsible for core-functioning of the product and increasing the performance of the product. Inactive ingredients include surfactants, preservatives and colorants.
In India, in 2019, the market of personal care chemicals segment stood at USD 1 billion and grew at a CAGR of 15.5% in the period 2014-19. Personal care chemicals market is estimated to reach USD 2.4 billion by 2025 at a CAGR of 15% over the period 2020-25. Active ingredients constitute about 40% of the market, whereas inactive ingredients account for the remaining 60%. Some of the key active ingredients used in the personal care industry are conditioning agents (21% of active ingredients market), UV ingredients (16%), anti-aging ingredients (8%) and exfoliants (8%). Anti-aging ingredients and exfoliants are expected to be the fastest growing chemicals in this industry.
Personal Care Chemicals Value Chain
The feedstock for the manufacturing of personal care chemicals can be petrochemical derivatives or natural products such as palm oil, coconut oil, soy bean oil etc., Innovation and differentiation are key factors that let the ingredient manufacturers maintain their position in the market and financial performance.
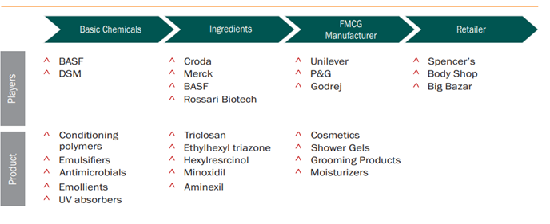
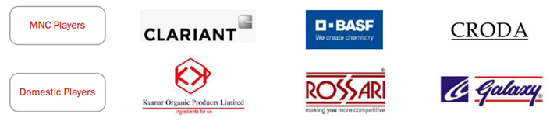
Key Players in Indian Personal Care Chemicals Segment
Growth Drivers
-
The reach to consumers in rural markets has increased with the advent of e-commerce platforms (Amazon, Flipkart) and dedicated personal care platforms (Nykaa, Purplle), coupled with increased consumer awareness have significantly increased the demand for personal care products.
-
Factors like increasing income levels, increasing young population and growth in organized retail markets are expected to drive the demand for high value added specialized active ingredients.
Emerging Trends in the Indian Specialty Chemicals Industry
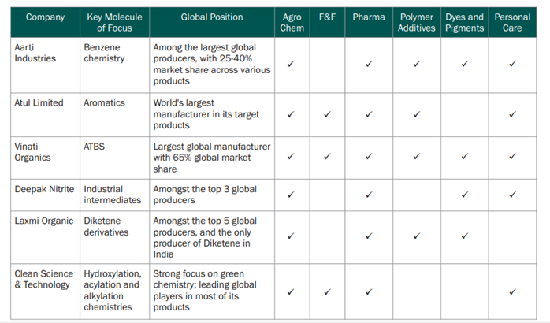
Over the last few years, the Indian specialty chemicals industry has witnessed the intertwined nature of business models, making it difficult to map to a particular end-user industry. The companies focused on developing expertise in one chemistry and then developing products that find applications across a wide range of industries. Later, the company looks to monetize the co-products and by-products in the same value chain. This approach creates a strong competitive advantage for the companies and maintains their dominant position in the market.
A) Establishing leadership position in select molecules and chemistries
Few players in the Indian industry have adopted this strategy of expanding into niche molecules/segments, which form a small part of the business for global players comparatively. The market size for these molecules is not significant to the multi-billion dollar firms and hence this protects the niche players from the global players and leaves them with significant room for growth.
Some of the methods adopted by the niche players are a) concentrated focus on 2-3 niche molecules and their derivatives b) constant efforts to distinguish their products through their research and expertise in chemistry c) Increasing their capacities as per their target segments and customers d) continuous investment to improve the value chain.
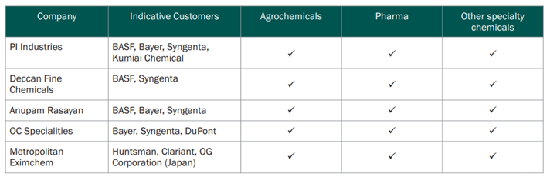
B) Contract Research and Manufacturing Services (CRAMS)
Over the past few decades, the resources (time and cost) involved in the development of new molecules have been increasing. The launch of new molecules demands extensive R&D, along with considerable investment to build engineering resources to produce the products and scale up the production. This made the global players outsource the manufacturing activity to their partners for long term. This enables the global companies to have a continuous supply at competitive prices and also protect their intellectual property rights (IPR).
India’s position as a strong CRAMS player is backed by a strong record of Indian pharmaceutical players. A proven track record with expertise in chemistry, low-cost manufacturing capabilities and extensive availability of skilled manpower make India, a favorable destination for CRAMS. Along with the companies’ competencies, government stringent policies on IPR protection make global companies prefer India over China.
Global Trends in the Specialty Chemicals Industry
The shape of the global specialty chemicals industry is being outlined by these global trends. Though the global trends cast a spell of uncertainty over the global industry, these trends bring out some opportunities in the near term for the Indian specialty chemicals industry.
A) Changing structure of China’s specialty chemicals industry
The change in the shape of specialty chemicals industry in China can be attributed primarily to three factors – stricter environmental norms, tighter financing and consolidation. These structural changes may consolidate the position of large players in China, but also cause uncertainty for global players and may open up opportunities in short-term for Indian specialty chemical companies in certain value chains and segments.
a) In the past few decades, China put the growth rate ahead of environmental concerns. Regulations that were conducive for business growth took a quick u-turn in 2016, with China’s 13th Five Year Plan seeking to address environmental concerns. China’s stricter environmental norms disrupted the supply chain of specialty chemicals. The government shut down the companies that flouted the environmental norms. In the years 2017 and 2018 alone, the government shut down around 80,000 companies.
b) Specialty chemicals industry is capital-intensive, hence it relies on corporate bonds and lending institutions to raise capital. Banks loans became expensive, eligibility criteria for loans became stricter and the chemical companies were charged higher than the average interest rate. Increased monitoring and regulation of corporate bonds made it tough for the companies to raise capital. This leads to a decrease in spending on capital expenditure.
c) There is an evident shift from overcapacity to consolidation phase in the industry structure. The players in the industry are strategically consolidating to establish a dominant position in the specialty chemicals industry, such as dyestuffs and plastics.
B) Rise of protectionism and trade conflicts
Trade conflicts rose around the world, especially among China, the US and Western Europe. There has been a series of imposed tariffs on Chinese products by US, and by China on American products. Still, the tariffs exist on US’ imports worth USD 20 billion products from China and similarly China’s imports worth USD 11 billion products from US. The repercussions of the trade conflicts would affect the stakeholders of the industry, across the world, not limited to US and China.
C) Companies’ move towards increased focus and global scale
Many companies are increasing their focus on core businesses and consolidation to reduce costs. Some companies sold off their core business like Akzo Nobel sold its specialty chemical business to PE companies Carlyle Group and GIC, later on, to form a new company called Nouryon. Few companies even underwent spinning-off their businesses. Dupont, one of the largest chemical companies in agriculture, material science and specialty products, split into three entities, each with a focused core. Companies are consolidating to increase their scale and achieve economies of scale, to supply the global players at a competitive price.
D) Digital Technology as a critical lever for efficiency and productivity
In the emerging world of technology, digital technology is the key to improving efficiency and productivity. Many companies are investing in digital assets as analytics to become flexible, agile and productive. The Indian companies can explore this opportunity and tap this potential.
Specialty Chemical Companies in India
|
Company |
CMP (Rs.) |
P/B |
MarketCap.(Cr) |
NetRevenue(Cr) |
Net Profit (Cr) |
TTM P/E |
|
Aarti Industries |
993.8 |
12.02 |
36,025 |
4,506 |
535 |
56.08 |
|
Atul |
9,217 |
7.08 |
27,291 |
3,731 |
652 |
40.36 |
|
Vinati Organics |
2,071 |
13.79 |
21,290 |
954 |
269 |
71.6 |
|
Navin Flourine |
4,099 |
12.45 |
20,308 |
1,179 |
247 |
80.32 |
|
Alkyl Amines |
3,650 |
23.60 |
18,641 |
1,242 |
295 |
60.19 |
|
Deepak Nitrite |
2,509.5 |
14.59 |
34,227 |
4,359 |
775 |
32.18 |
|
UPL |
760.4 |
2.69 |
58,098 |
38,694 |
3,453 |
18.34 |
|
PI Industries |
3,012 |
8.55 |
45,697 |
4,577 |
733 |
57.7 |
|
Bayer CropScience |
4,960 |
8.74 |
22,291 |
4,261 |
493 |
52.5 |
|
BASF |
2,961 |
7.19 |
12,817 |
9,558 |
552 |
25.66 |
- Share :


Post a Comment
|
DISCLAIMER |
This report is only for the information of our customers. Recommendations, opinions, or suggestions are given with the understanding that readers acting on this information assume all risks involved. The information provided herein is not to be construed as an offer to buy or sell securities of any kind. ATS and/or its group companies do not as assume any responsibility or liability resulting from the use of such information.