RUSHIL DECOR
RUSHIL DECOR started operations in 1993, engaged in the manufacturing of medium density fibre (MDF) and decorative laminate products. It offers engineered interior products, which include decorative laminate sheets, Industry laminate sheets and Rushil kitchen door under “Vir Laminate” or “Rushil” or “Signor” brand.
|
BSE Code |
533470 |
|
NSE Code |
HCLTECH |
|
Reuters Code |
RUSH.NS |
|
INCEPTION |
1993 |
|
IPO |
2007 |
|
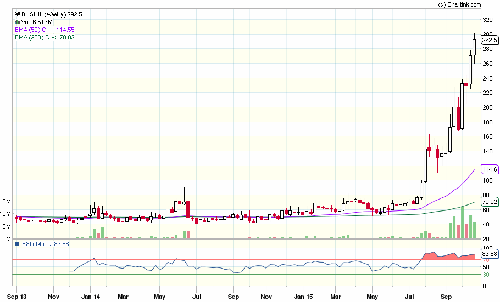
CMP (as on 30/10/2015) |
275 |
|
Stock Beta |
0.98 |
|
52 Week H/L |
53.50 / 300.80 |
|
Market Cap (Cr) |
408 |
|
Equity Capital (Rs cr) |
14.40 |
|
Face Value (Rs) |
10.00 |
|
Average Volume |
703894 |
|
|
|
|
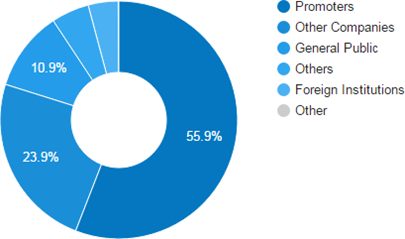
Shareholding Pattern (%) |
|
|
Promoters |
55.91 |
|
Non Institutions |
44.08 |
|
Grand Total |
100.00 |
RUSHIL DECOR - Potential Catalysts
-
Significant growth opportunities
-
Implementation of GST to benefit the company
-
Network and Global Presence.
-
Diversifying customer base
RUSHIL DECOR - Recommendation
With Superior project management skills, focus on measuring and monitoring quality and its planned expansion RUSHIL will be able to grow over the next few years. We recommend BUY on the stock at CMP of Rs. 275 to target of Rs. 331.
RUSHIL DECOR - Financial Summary
|
Yearly Income Statement |
201403 |
201503 |
2016 E |
2017 E |
2018 E |
|
Revenue |
257.30 |
278.08 |
303.26 |
327.82 |
354.33 |
|
EBIDTA |
29.59 |
24.67 |
33.43 |
38.23 |
39.81 |
|
EBIT |
21.96 |
17.75 |
25.69 |
30.36 |
30.24 |
|
Adjusted Profit After Tax |
3.01 |
5.37 |
6.24 |
8.57 |
7.16 |
|
EPS (Unit Curr.) |
2.09 |
-0.45 |
4.33 |
5.95 |
4.97 |
|
EBIDTA Margin |
12.12% |
9.15% |
11.46% |
12.11% |
11.66% |
|
EBIT Margin |
9.00% |
6.58% |
8.81% |
9.62% |
8.85% |
|
PAT Margin |
1.17% |
1.93% |
2.06% |
2.61% |
2.02% |
BUSINESS DISCRIPTION
Rushil Decor Limited is an India-based company. It is engaged in the manufacturing of particle board products and decorative laminate products. It offers engineered interior products, which include Decorative Laminate Sheets, Industry laminate Sheets, Rushil Kitchen Door and Plain Particle Boards. The Company’s products consist of Laminates, Particle Board, Toilet Cubicles, Veneer and Medium Density Fiber (MDF) board. Its manufacturing facilities are located in Gujarat and Karnataka. Rushil’s markets its products under the brand name, Vir Laminate. MDF board is a panel product manufactured from lignocelluloses fibers combined with resin. The applications of MDF Board include Building and Construction, Furniture, Industrial and Handicraft.
MDF products are sold under the brand name “Vir MDF Boad”. It has three decorative laminate manufacturing units in Gujarat and one MDF manufacturing unit in Karnataka under ISO 9001:2000 certifications for quality; ISO 18001:1999 certification for health & safety and ISO14001: 2004 for environmental system for all the units.
Shareholding pattern as on 30th Sept, 2015
|
|
No of Shares |
% of Holding |
% of Holding |
% of Holding |
% of Holding |
|
Description as on |
30/09/2015 |
30/09/2015 |
30/06/2015 |
31/03/2015 |
31/12/2014 |
|
Foreign (Promoter & Group) |
0 |
0 |
0 |
0 |
0 |
|
Indian (Promoter & Group) |
8051734 |
55.91 |
55.91 |
55.91 |
55.93 |
|
Total of Promoter |
8051734 |
55.91 |
55.91 |
55.91 |
55.93 |
|
Non Promoter (Institution) |
592352 |
4.11 |
5.86 |
6.8 |
6.8 |
|
Non Promoter (Non-Institution) |
5755914 |
39.97 |
38.23 |
37.29 |
37.27 |
|
Total Non Promoter |
6348266 |
44.08 |
44.09 |
44.09 |
44.07 |
|
Total Promoter & Non Promoter |
14400000 |
99.99 |
100 |
100 |
100 |
|
Custodians(Against Depository Receipts) |
0 |
0 |
0 |
0 |
0 |
|
Grand Total |
14400000 |
100 |
100 |
100 |
100 |
MANAGEMENT & GOVERNANCE
The company’s management includes Mr.Krupeshbhai G Thakkar, Mr.Rohitbhai B Thakkar, Mr.Shankar Prasad Bhagat, Mr.Vipul S Vora, Ms.Jingle P Thakkar, Mr.Ghanshyambhai A Thakkar, Mr.Hasmukh K Modi, Mr.Hasmukh K Modi, Mr.Kaushikbhai J Thakkar, Mr.Keyur M Gajjar.
Company has Parikh & Majumdar as its auditors. The company has a total of 14,400,000 shares outstanding.
INDUSTRY OUTLOOK
The laminates industry in India to a great extent is a sector portion where customer association and knowledge about the item is low, with most customers not being aware of the different choices accessible. In India, when individuals have any furniture necessities, they simply approach the neighborhood craftsman in their general vicinity, and request a quote.
Indian HPL Industry has been consistently growing since last six to seven years. The last two years have been boom time for new laminate units. Research shows there has been a total production of 1.35 to 1.40 Crore sheets every month in India i.e. approximately 13.5 million sheets per month that includes export and domestic market.
The HPL production capacity has been growing year on year. In terms of number of sheets, the production has seen a growth of 12.7% since 2012. With growth in decorative laminate demands during 2012 and 2013 by snatching up some share of reconstituted veneers and from the furniture industry (laminates are being used instead of painting the inside areas of furniture), laminates grabbed around 15% growth.
The Indian laminate industry and trade is estimated to be of Rs. 5100 Crores per annum in India. The below graph shows the year wise turnover (in Crores INR).
If we compare it to the past few years, the growth has come down by 2 to 3%. Since last year, value wise Indian laminate industry is growing more in Liner grade or commodity materials where operating margins are already at the base level.
The actual growth in HPL in volumes of quality materials is estimated to be around 5 to 6%, considering the balance contribution to growth due to inflation effects.
The government of India under Prime Minister has a vision of developing 100 smart cities as satellite towns of larger cities and by modernizing the existing mid-sized cities. Because of this housing sales are estimated to rise this year to 1.92 lakh units in India's top seven cities on expectations of a cut in interest rate and stable prices
The reasons for growth are positive sentiments, emerging new areas and demand in already growing cities with new Government and growing commitment to work for social growth. With the emergence of new ways in retailing of laminates and other surface materials, Indian HPL industry and trade can hope for better growth, if working with systems and aggression.
INVESTMENT RATIONALE
Network and Global Presence
Strong and wide distribution network in domestic as well as international market
The Company’s product is exported to regions such as North America, South America, Europe, Middle East, China, South East Asia and Far East Asia
Significant growth opportunities
Plywood market today is largely controlled by the unorganized sector which accounts for 75% of the market. However, driven by lower price differential and increasing preference for branded wood panel products there is a clear shift, with the organized players growing at 15.2% over FY08-13 as compared to industry growth of 6-8%. We believe that implementation of GST is a potential “Game Changer” for plywood manufacturers as further lowering differential in indirect taxes would mean acceleration in the pace of consumer shift from unorganized players to branded organized market which in turn would improve the growth trajectory for players like Rushil.
Structural shift in favour of organized players; GST potential Game Changer
With the roll out of GST, the pricing difference between organized and unorganized players due to tax inequalities is likely to significantly narrow down, which will provide a level playing field to organized players. This coupled with a shift towards branded products indicates that the organized plywood market (currently ~| 3500-4500 crore) is expected to grow at a healthy pace of 15-25%, going ahead. With strong brand recall, robust distribution network, security over raw material & expansion in margin on account of operating leverage, we expect Rushil’s earnings to grow at a faster pace, going ahead
-
Company to benefit with growth in long term housing and infrastructure
-
Huge gap in demand supply of housing and other end markets
Capacity expansion to drive Medium Density Fibreboard (MDF) business growth
The MDF market is worth Rs 13 billion in India, growing at a CAGR of 15-20% over the last five years. It is used as a superior substitute for cheap unorganized plywood. Demand in this sector is driven by ready-made modular furniture, modular kitchen, ready-to-move into offices/retail outlets etc. In last five years, revenue contribution from MDF business has increased from 6% in FY11 to 26% in FY15. Also, MDF EBITDA margin has improved substantially from 15.4% in FY12 to 23.3% in FY15.
Diversifying customer base
-
Strong and growing order book
-
Increasing base of international and domestic customers
-
Robust organic growth
-
Focused on improving shareholders return
-
Consistently increasing operating margins
-
Healthy cash flow from operations
VALUATION
Rushil is currently trading at 275 per share with a market capitalization of 408 Crores. It has total debt of 57.15 Cr with long term Debt to Equity of 0.89. It has total cash of 6.89 Cr and Cash & Eq of 133.26 Cr.
In the recent past company is utilizing all its cash flow to capex and operations.
|
Dividend |
||
|
Year End |
Dividend-Amount |
Dividend-% |
|
201503 |
0 |
0 |
|
201403 |
0 |
0 |
|
201303 |
0.72 |
5 |
|
201203 |
0.72 |
5 |
|
201103 |
0.72 |
5 |
|
201003 |
2.63 |
30 |
|
200903 |
1.75 |
20 |
|
200803 |
0.8 |
10 |
|
200703 |
0.09 |
10 |
|
200603 |
0.12 |
10 |
|
200503 |
0.02 |
10 |
|
|
GreenplyInds. |
MerinoInds. |
GreenlamIndustr |
StylamIndus. |
BloomDekor |
Alfa Ica (I) |
|
Rushil Decor |
Average |
|
201503 |
201503 |
201503 |
201503 |
201503 |
201503 |
201503 |
|
||
|
View in (Million) |
|
|
|||||||
|
Sales |
1566.74 |
908.25 |
885.06 |
213.81 |
63.16 |
57.06 |
|
275.66 |
|
|
PAT |
124.23 |
72.56 |
19.34 |
9.39 |
0.69 |
1.06 |
-0.65 |
||
|
|
|||||||||
|
OPM % |
13.08 |
16.06 |
10.28 |
10.4 |
11.94 |
6.36 |
|
10.36 |
11.35 |
|
NPM % |
7.93 |
7.99 |
2.19 |
4.39 |
1.09 |
1.86 |
-0.24 |
4.24 |
|
|
EPS |
50.86 |
69.05 |
7.91 |
12.84 |
0.88 |
2.63 |
-0.43 |
24.03 |
|
|
PE |
18.07 |
0 |
56.69 |
8.93 |
17.97 |
7.24 |
- |
18.15 |
|
|
P/EPS |
13.11 |
0 |
20.8 |
6.17 |
3.59 |
4.44 |
15.82 |
8.02 |
|
|
BV |
201.49 |
249.05 |
91.07 |
60.2 |
24.79 |
26.28 |
51.41 |
108.81 |
|
|
P/BV |
4.62 |
0 |
4.99 |
1.9 |
0.73 |
0.72 |
1.34 |
2.16 |
|
We value RUSHIL using DCF and Multiple valuations at price target of 331 for FY16 with expected growth rate at 8.2% per annum. For valuation we assume that over the period company will keep capital structure unaltered and tax rate unchanged.
|
Valuation Ratios |
201203 |
201303 |
201403 |
201503 |
|
PBIDT/Sales (%) |
11.57 |
12.98 |
10.84 |
8.34 |
|
Sales/Net Assets |
0.87 |
0.94 |
1.21 |
1.51 |
|
PBDIT/Net Assets |
0.1 |
0.12 |
0.13 |
0.13 |
|
Net Assets/Net Worth |
2.67 |
2.85 |
3.01 |
2.65 |
|
ROE (%) |
11.99 |
5.72 |
4.12 |
-2.32 |
The debt reduction was driven by the company's robust operating performance, surplus in working capital, lower capital expenditure and the proceeds from its asset sales.
|
|
201203 |
201303 |
201403 |
201503 |
|
Key Ratios |
||||
|
Debt-Equity Ratio |
2.1 |
1.69 |
1.84 |
1.76 |
|
Long Term Debt-Equity Ratio |
1.05 |
0.94 |
0.99 |
0.89 |
|
Current Ratio |
0.92 |
0.95 |
0.95 |
0.94 |
Turnover Ratios
|
Fixed Assets |
2.87 |
1.71 |
1.58 |
1.74 |
|
Inventory |
4.13 |
4.29 |
4.72 |
4.87 |
|
Debtors |
5.41 |
5.31 |
6.72 |
6.91 |
|
Total Asset Turnover Ratio |
1.01 |
0.99 |
1.27 |
1.4 |
|
Interest Cover Ratio |
1.97 |
1.77 |
1.42 |
1.65 |
|
ROCE (%) |
10.08 |
10.18 |
10.22 |
11.26 |
|
RONW (%) |
11.99 |
5.72 |
4.12 |
-2.32 |
|
Payout (%) |
13 |
18.41 |
0 |
0 |
CONCUSSION AND RECOMMENDATION
With Superior project management skills, focus on measuring and monitoring quality and its planned expansion RUSHIL will be able to grow over the next few years. We recommend BUY on the stock at CMP of Rs. 275 to target of Rs. 331.
RISKS AND CONCERNS
-
Protracted low inflation or deflation could weigh on growth.
-
Geopolitical risks in several regions could disrupt trade in commodities and financial transactions.
-
Unavailability of skilled professionals might impact prospects
FINANCIALS
Rushil Decor Ltd. key Products/Revenue Segments include
-
Decorative Laminates which contributed Rs 158.85 Cr to Sales Value (57.62% of Total Sales)
-
Fibre Board which contributed Rs 102.67 Cr to Sales Value (37.24% of Total Sales)
-
Licence Fees which contributed Rs 3.33 Cr to Sales Value (1.20% of Total Sales)
-
Bagasse which contributed Rs 2.82 Cr to Sales Value (1.02% of Total Sales)
-
Export Incentives which contributed Rs 2.72 Cr to Sales Value (0.98% of Total Sales)
-
Methanol which contributed Rs 2.12 Cr to Sales Value (0.76% of Total Sales)
-
Phenol which contributed Rs 2.01 Cr to Sales Value (0.72% of Total Sales)
-
Particle Boards which contributed Rs 0.92 Cr to Sales Value (0.33% of Total Sales)
-
Laminate Sheets which contributed Rs 0.21 Cr to Sales Value (0.07% of Total Sales)
-
Kraft Paper which contributed Rs 0.00 Cr to Sales Value (0.00% of Total Sales)
-
Alcohol which contributed Rs 0.00 Cr to Sales Value (0.00% of Total Sales)
-
Tapes which contributed Rs 0.00 Cr to Sales Value (0.00% of Total Sales)
for the year ending 31-Mar-2015.
For the quarter ended 30-Jun-2015, the company has reported a Standalone sales of Rs. 69.74 Cr., down -2.14% from last quarter Sales of Rs. 71.26 Cr. and up 3.35% from last year same quarter Sales of Rs. 67.47 Cr. Company has reported net profit after tax of Rs. 2.07 Cr. in latest quarter.
|
Equity |
|||
|
Date |
Increase in Equity Amount(Rs Cr) |
No. of Equity Shares Increased |
Reason |
|
2/7/2011 |
5.64 |
5643750 |
Public Issue |
|
2/9/2008 |
0.8 |
800000 |
Issued To Promoters |
|
27/03/2007 |
5.99 |
5991250 |
Bonus Issue |
|
8/3/2007 |
1.77 |
1770000 |
Further Issue |
|
12/1/1998 |
0.1 |
100000 |
Further Issue |
|
26/11/1993 |
0.09 |
85000 |
Further Issue |
|
29/06/1993 |
0 |
9980 |
Equity shares issued |
|
Yearly Income Statement |
201203 |
201303 |
201403 |
201503 |
2016 E |
2017 E |
2018 E |
|
Net Sales |
147.35 |
172.46 |
244.08 |
269.60 |
291.71 |
315.63 |
341.51 |
|
Other Income |
1.25 |
1.48 |
1.63 |
2.43 |
2.62 |
2.99 |
3.36 |
|
Other Operating Income |
5.83 |
9.56 |
11.59 |
6.05 |
8.93 |
9.20 |
9.47 |
|
Total Income |
154.43 |
183.50 |
257.30 |
278.08 |
303.26 |
327.82 |
354.33 |
|
Total Expenditure |
135.86 |
158.59 |
227.71 |
253.41 |
269.83 |
289.59 |
314.53 |
|
EBIDTA |
18.57 |
24.91 |
29.59 |
24.67 |
33.43 |
38.23 |
39.81 |
|
Depreciation |
2.56 |
5.12 |
7.63 |
6.92 |
7.73 |
7.87 |
9.57 |
|
EBIT |
16.01 |
19.79 |
21.96 |
17.75 |
25.69 |
30.36 |
30.24 |
|
Interest |
8.15 |
11.17 |
15.43 |
14.35 |
17.76 |
19.51 |
21.17 |
|
PBT |
7.86 |
8.62 |
6.53 |
3.40 |
7.93 |
10.85 |
9.07 |
|
Tax |
2.20 |
1.86 |
1.40 |
0.72 |
1.70 |
2.28 |
1.92 |
|
Deferred Tax |
0.00 |
2.74 |
2.12 |
3.33 |
0.00 |
0.00 |
0.00 |
|
Adjusted Profit After Tax |
5.66 |
4.02 |
3.01 |
-0.65 |
6.24 |
8.57 |
7.16 |
|
Extra-ordinary Items |
-0.03 |
0.00 |
0.00 |
-6.02 |
0.00 |
0.00 |
0.00 |
|
Adjusted Profit After Extra-ordinary item |
5.69 |
4.02 |
3.01 |
5.37 |
6.24 |
8.57 |
7.16 |
|
|
|||||||
|
Equity |
14.40 |
14.40 |
14.40 |
14.40 |
14.40 |
14.40 |
14.40 |
|
Face Value |
10.00 |
10.00 |
10.00 |
10.00 |
10.00 |
10.00 |
10.00 |
|
EPS (Unit Curr.) |
4.37 |
2.80 |
2.09 |
-0.45 |
4.33 |
5.95 |
4.97 |
|
Outstanding Shares |
14400000 |
14400000 |
14400000 |
14400000 |
14400000 |
14400000 |
14400000 |
|
|
|||||||
|
EBIDTA Margin |
12.60% |
14.44% |
12.12% |
9.15% |
11.46% |
12.11% |
11.66% |
|
EBIT Margin |
10.87% |
11.48% |
9.00% |
6.58% |
8.81% |
9.62% |
8.85% |
|
PAT Margin |
3.68% |
2.19% |
1.17% |
1.93% |
2.06% |
2.61% |
2.02% |
Balance Sheet
|
SOURCES OF FUNDS: |
201203 |
201303 |
201403 |
201503 |
|
|
||||
|
Share Capital |
14.4 |
14.4 |
14.4 |
14.4 |
|
Reserves & Surplus |
54.57 |
57.43 |
60.46 |
59.63 |
|
Loan Funds |
105.61 |
111.38 |
127.52 |
99.55 |
|
Deferred Tax Liability |
5.94 |
8.68 |
10.8 |
14.04 |
|
Other Liabilities |
4.5 |
6.13 |
6.53 |
4.72 |
|
Total Liabilities |
185.02 |
198.02 |
219.71 |
192.34 |
|
|
||||
|
APPLICATION OF FUNDS: |
|
|||
|
Fixed Assets |
135.89 |
148.97 |
154.8 |
136.74 |
|
Intangible Assets |
0.05 |
0.05 |
0 |
0 |
|
Investments |
0.01 |
0.01 |
0.01 |
0.01 |
|
Current Assets, Loans & Advances |
93.66 |
110.73 |
132.56 |
116.57 |
|
Inventories |
39.25 |
50.26 |
65.32 |
56.32 |
|
Sundry Debtors |
33.15 |
39.19 |
42.11 |
43.54 |
|
Cash & Bank Balance |
4.51 |
4.7 |
5.59 |
6.89 |
|
Loans & Advances |
16.75 |
16.58 |
19.54 |
9.82 |
|
Current Liabilities & Provisions |
49.45 |
66.58 |
76.75 |
69.6 |
|
Current Liabilities |
48.3 |
65.11 |
76.09 |
68.92 |
|
Provisions |
1.15 |
1.47 |
0.66 |
0.68 |
|
Net Current Assets |
44.21 |
44.14 |
55.81 |
46.97 |
|
Other Assets |
4.86 |
4.85 |
9.09 |
8.63 |
|
Total Assets |
185.02 |
198.02 |
219.71 |
192.34 |
|
Total Current Assets |
174.03 |
188.55 |
238.29 |
328.26 |
|
- Current Investments |
0 |
0 |
0 |
0 |
|
- Inventories |
0.02 |
0.31 |
0 |
0.29 |
|
- Trade Receivables |
125.66 |
140.98 |
155.61 |
154.08 |
|
- Cash & Cash Equivalents |
26.72 |
23.3 |
51.46 |
133.26 |
|
- Short Term Loans & Advances |
10.38 |
8.23 |
12.02 |
14.69 |
|
- Other Current Assets |
11.25 |
15.74 |
19.2 |
25.95 |
|
Other Assets |
0 |
0 |
0 |
0 |
|
TOTAL ASSETS |
334.62 |
363.4 |
388.42 |
465.53 |
- Share :


Post a Comment
|
DISCLAIMER |
This report is only for the information of our customers. Recommendations, opinions, or suggestions are given with the understanding that readers acting on this information assume all risks involved. The information provided herein is not to be construed as an offer to buy or sell securities of any kind. ATS and/or its group companies do not as assume any responsibility or liability resulting from the use of such information.