POWER FINANCE CORPORATION LIMITED
Power Finance Corporation Limited - COMPANY PROFILE
Power Finance Corporation Limited was set up in the year 1986 and is dedicated to power sector financing and to the integrated development of the power and associated sectors. The Company is registered as a Non Banking Financial Company (NBFC) with the Reserve Bank of India (RBI). On July 28, 2010, RBI, classified the company as an ‘Infrastructure Finance Company (NBFC-ND-IFC)’. The Company provides financial resources to the power and associated sectors.
Power Finance Corporation Ltd product portfolio comprises of financial products and services like project term loans, equipment lease financing, discounting of bills, short term loans, and consultancy services for various power projects in generation, transmission, and distribution sector as well as for renovation & modernization of existing power projects. In addition, PFC also provides technical, advisory and consultancy to power sector companies through its subsidiary company namely PFC Consulting Limited.
For FY 2014, the Company’s total income from operations grew by 24.92 % to Rs. 21,614.53 Cr. as against Rs. 17,302.61 Cr. in FY 2013. For the same period, net profit went up by 23.08 % to Rs. 5,461.84 Cr. as against Rs. 4,437.74 Cr. in FY 2013.
Power Finance Corporation Limited - STOCK INFORMATION
|
STOCK PRICE |
273.55 |
|
TARGER PRICE |
265-255 |
|
SECTOR |
FINANCE |
|
SYMBOL (AT NSE) |
PFC |
|
ISIN |
INE134E01011 |
|
FACE VALUE (IN RS.) |
10.00 |
|
BSE CODE |
532810 |
Power Finance Corporation Limited - STOCK FUNDAMENTALS
|
MARKET CAP |
35957.91 |
|
BOOK VALUE |
208.50 |
|
EPS - (TTM) (IN RS. CR.) |
0.00 |
|
P/E |
0.00 |
|
INDUSTRY P/E |
8.20 |
CREDIT COSTS INCREASING, ASSEST QUALITY RISK NOT OUT- SIZED
With RBI prudential norms being adopted by the company, albeit with one year lag and exceptions on transmission, distribution and hydroelectric generation, credit costs will remain elevated. From i) our effort at reconstructing the company’s project portfolio based on multiple public sources and ii) critical examination of key drivers like gas based generation exposure, share of commissioned projects financed etc. we formulated a bear, bull and base case scenario on asset quality. The results of the scenario analysis pro- vide comfort on BVPS, RoE and indeed dividend sustainability across business outcomes. Our repayment and revenue accrual related analytics suggest that while cash flows from borrowers did weaken in FY15.
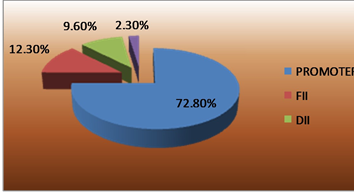
Power Finance Corporation Limited - SHAREHOLDING PATTERN
MARGIN LIKE TO GET SQUEEZED, ROE COULD DECLINE
With RBI’s notification to banks allowing them to raise long term bonds for infrastructure project finance with zero regulatory costs, yields are likely to contract. This may intensify as balance sheets of players in the power ecosystem improve from either equity infu- sions or operations. The resulting margin squeeze (limited borrow- ing cost play barring policy rate cuts) and enhanced credit costs will drive a likely ~300bps compression in RoE.
RESULTS (Quarterly )(Rs CR.)
|
|
DEC' 14 |
SEP' 14 |
JUN' 14 |
MAR 14 |
DEC' 13 |
|
Sales |
6,434.65 |
6,304.70 |
5,918.39 |
5,632.36 |
5,539.23 |
|
Operat- ing profit |
6,356.63 |
6,246.86 |
5,865.69 |
5,546.73 |
5,500.31 |
|
Interest |
4,205.94 |
4,228.22 |
3,865.70 |
3,557.59 |
3,452.26 |
|
Gross profit |
2,154.39 |
2,022.99 |
2,005.50 |
1,992.87 |
2,056.13 |
TECHNICAL VIEW
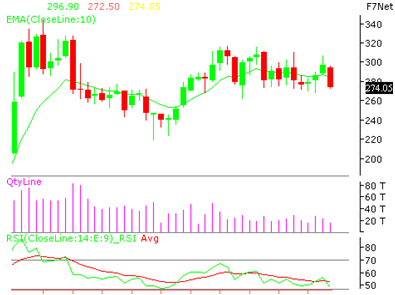
PFC LTD is looking weak on charts. We advise to sell around 275-280 with stoploss of 290 for the targets of 265-255 levels. RSI is also showing downside momentum in it on daily charts.
|
SYMBOL |
VALUE |
ACTION |
|
RSI(14) |
18.327 |
OVERSOLD |
|
STOCH(9,6) |
30.508 |
SELL |
|
STOCHRSI(14) |
0.000 |
OVER SOLD |
|
MACD(12,26) |
-4.180 |
SELL |
|
ADX(14) |
41.201 |
SELL |
|
WILLIAMS %R |
-95.157 |
OVERSOLD |
|
CCI(14) |
-165.0759 |
SELL |
|
ATR(14) |
2.6143 |
HIGH VOLATILITY |
|
HIGH/LOWS(14) |
-108000 |
SELL |
|
ULTIMATE OSCILLATOR |
28.055 |
OVERSOLD |
|
ROC |
-5.875 |
SELL |
|
BULL/BEAR POWER()13 |
-16.1480 |
SELL |
|
BUY: 0 SELL:7 NEUTRAL: 4 |
SUMMARY : STRONG SELL |
|
Our Other Recommendation for Next Week
|
SCRIP |
ACTION |
CMP |
ENTRY |
SL |
TGT |
TIME FRAME |
|
VOLTAS |
BUY |
288.95 |
285-290 |
278 |
296-302 |
ONE WEEK |
|
DLF |
BUY |
158.25 |
155-158 |
152 |
162-165 |
ONE WEEK |
|
RECL |
SELL |
331.65 |
335-340 |
352 |
325-310 |
ONE WEEK |
|
LIC HOUSING |
SELL |
449.5 |
445-442 |
452 |
435-420 |
ONE WEEK |
|
BATA INDIA |
SELL |
1164.2 |
1180-200 |
1230 |
1150-120 |
ONE WEEK |
Performance of Previous Week
|
SCRIP |
LOT |
ACTION |
ENTRY |
SL |
TGT |
P&L |
REMARK |
CLOSE/LOW/HIGH |
|
SUN PHARMA |
250 |
BUY |
1020-1040 |
995 |
1065-1080 |
-1750.00 |
NEAR COST |
1013.85/ 1058.55 |
|
RANBAXY |
500 |
BUY |
790-800 |
778 |
820-840 |
15000.00 |
FIRST TGT HIT |
795.80 / 830.70 |
|
AUROPHARMA |
250 |
BUY |
1080-1095 |
1060 |
1120-1145 |
16250.00 |
BOTH TGT HIT |
1151.95 / 1184.80 |
|
RELINFRA |
500 |
BUY |
490-495 |
478 |
510-525 |
-6000.00 |
SL TRG |
463.80 / 497.80 |
|
COAL INDIA |
1000 |
SELL |
370-375 |
385 |
360-350 |
10000.00 |
FIRST TGT HIT |
366.70 / 358.40 |
|
HINDALCO |
2000 |
SELL |
150-152 |
155 |
147-142 |
36000.00 |
BOTH TGT HIT |
|
|
NET PROFIT |
|
|
|
|
|
69500.00 |
|
|
- Share :


Post a Comment
|
DISCLAIMER |
This report is only for the information of our customers. Recommendations, opinions, or suggestions are given with the understanding that readers acting on this information assume all risks involved. The information provided herein is not to be construed as an offer to buy or sell securities of any kind. ATS and/or its group companies do not as assume any responsibility or liability resulting from the use of such information.