PI INDUSTRIES LTD
KEY INFORMATION FOR PI INDUSTRIES LIMITED
|
Date |
08 January 2021 |
|
Market Price (INR) |
2335 |
|
52Week H/L |
2650/970.1 |
|
Market Cap (INR Bn) |
354.71 |
|
Shares Outstanding (Mn) |
152 |
|
Industry |
Agrochemical |
|
Recommendation |
Buy |
|
Target Price |
2713 |
|
Upside/Downside |
14.3% |
|
Key Financial |
FY20 |
FY21E |
FY22E |
FY23E |
|
Sales |
33,665 |
41,882 |
53,824 |
66,920 |
|
Growth (%) |
18.50% |
24.41% |
28.51% |
24.33% |
|
EBITDA |
7,178 |
9,732 |
12,934 |
16,186 |
|
Margin (%) |
21.32% |
23.24% |
24.03% |
24.19% |
|
PAT |
4,566 |
6,263 |
8,285 |
10,309 |
|
EPS |
33.097 |
41.204 |
54.506 |
67.823 |
|
Growth (%) |
11.30% |
24.50% |
32.28% |
24.43% |
|
DPS |
3.6 |
7.0048 |
10.901 |
13.565 |
|
ROE (%) |
17.43% |
19.94% |
21.78% |
22.28% |
|
ROCE (%) |
22.96% |
26.68% |
30.00% |
31.52% |
|
EV/EBITDA(x) |
60.7x |
48.8x |
36.0x |
27.1x |
|
P/E(x) |
68.6x |
55.1x |
41.6x |
33.5x |
|
Share Holding Pattern (%) |
|
|
Promoter |
46.75% |
|
FIIs |
14.72% |
|
DIIs |
25.74% |
|
Others |
12.79% |
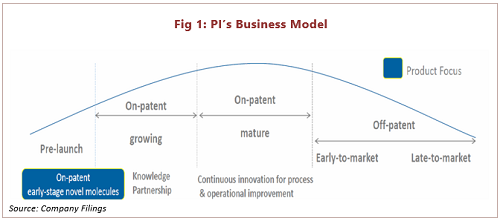
A unique business model of PI’s Growth
PI Industries follows the in-licensing model in domestic markets, whereas the contract manufacturing (CSM) business model in the export market. It is a unique business model.
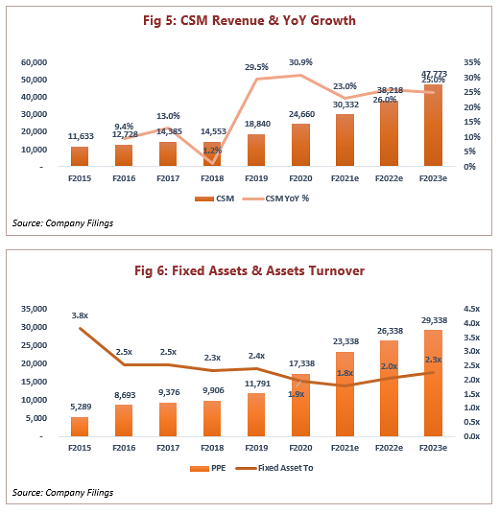
PI Industries is an established leader in the CSM business in India. They have built a niche in process engineering of agrochemical by leveraging their R&D process and manufacturing capabilities. PI is collaborated with more than 18 global innovators for contract manufacturing of intermediates and molecules. The company has a sturdy order book of USD 1.5 bn, that can be executed in the next 3-4 years. The company is coming up with a new production facility in Jambusar, Gujarat plant, which would provide a robust revenue and earnings visibility for the next 3-4 years to support the healthy order book. We expect PI’s CSM business revenue would grow at a CAGR of 24.7% over the F20-F23E.
PI forays into the new business segment like pharma, and specialty chemical, and follows a superior and successful CSM business model. We believe this would be a key catalyst in the future.
PI Industries is leveraging its strong relationship with global players to offer novel products, followed by an in-licensing business model. The company has a strong product pipeline, a recently launched product, superior brand-building capabilities, and the distribution network’s vast reach. The domestic business is expected to grow at a CAGR of 15.7% over F20-F23E.
Available at an attractive valuation
The robust revenue visibility prospects across all segments would deliver a healthy earnings growth of 31.2% to the bottom line over the next three years. We believe that PI deserves a premium valuation compared to its peers and is valued at PE 35x F23E EPS, and arrived at a target price of INR 2374.
COMPANY PROFILE
PI Industries Ltd has been using science to revolutionize agriculture in India with some of the largest Agro brands in its portfolio, bringing innovation to the agro-input space, increasing productivity, enhancing output, and creating economic value for millions of farmers for a better life. Today the company has a strong marketing and distribution network in India with 10,000 active dealers/distributors. It has reached more than 1 Lakh retailers with strong agricultural extension capabilities and unique product delivery mechanism and has created a successful track record of earning farmers’ trust with innovative ideas.
MANAGEMENT PROFILE
|
Name |
Designation |
|
Raman Ramachandran |
CEO, Director & MD |
|
Prashant Hegde |
CEO – Agro Chem Business |
|
Rajiv Batra |
Chief Financial Officer |
|
K.V.S Rao |
CEO – CSM Business |
|
Mayank Singhal |
Executive Vice Chairman of the Board, Managing Director |
|
Devendra Ray |
President & Head-Mfg Strategy |
|
Rahul Gautam |
Chief People Officer |
|
Sameer Dhaga |
Chief Information Officer |
|
Atul Gupta |
President – Operation |
|
Anand Kamat |
Sr. VP – Supply Chain |
|
P.V. Srinivas |
Sr. VP – Process Technology |
|
Naresh Kapoor |
Compliance Officer & Company Secretary |
|
K.V. Satish Kumar |
Chief Sustainability Officer |
A healthy order book in CSM business remains the key growth driver
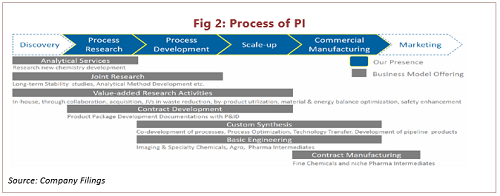
PI Industries is an established leader in the agrochemical CSM business in India. They have built a niche in the process engineering of agrochemicals by leveraging their vital research and manufacturing capabilities. PI offers a one-stop solution for process scale-up and large-scale manufacturing for global innovators.
The company helps global manufacturers efficiently commence their newly discovered molecules by providing them with research and commercial manufacturing services. Their cost-efficient manufacturing, skills in chemistry, and quality-driven services are an overall value proposition for global manufacturers.
In the CSM business, PI’s strategy is to focus on early-stage, patented molecules. It is either the only supplier or one or two suppliers focused on complex chemistries involving multiple production processes. In this business, the company enters into multi-year or annual contracts with its customers. PI Industries Ltd chooses to renew specific contracts annually for the flexibility that provides, like switching to more remunerative molecules should an opportunity arise. The long-term agreements are fully hedged on currency risk and commodity price risk, supporting the steady profit margins.
Global innovators rely on superior technology and innovation capabilities for the outsourcing partner like PI Industries Ltd has. This kind of CSM business once scaled up then it is a low-risk business model that provides strong revenue visibility and steady profitability.
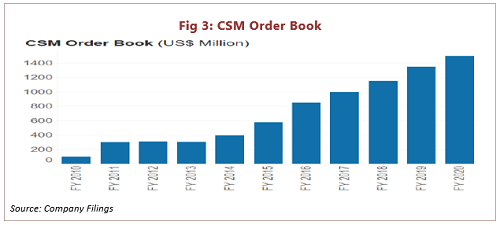
The company has a robust and proven track record over the last 20 years and built up a healthy CSM order book of USD 1.5 bn, and has expected to execute within the next 3-5 years. They also take spot contracts on a typically annual basis, contributing 20-25% to CSM business’s revenues.
PI Industries has a relationship with more than 18 global innovators and works with most of them. Its top 5 clients generate 50-55% of CSM business revenue.
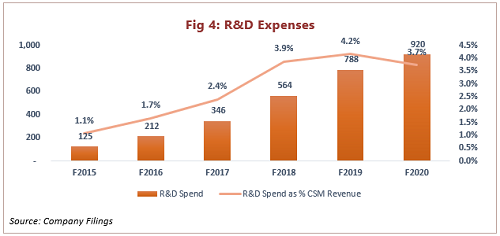
Due to the supply-side disruption in china, the company has witnessed higher inquiries from global players. The R&D spending has increased sharply over the last few years, reflecting a higher number of molecules in the pipeline. During Fy20, it carried out the synthesis of 44 new development molecules. Out of these, 13 molecules scaled up successfully, and five molecules were transferred to the next stage. With the higher number of molecules under the scale-up phase, the management is very confident to commence 6-7 molecules annually.
Adding capacity to support growing order book
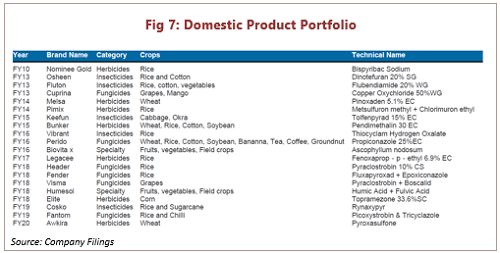
The order book of PI Industries has been growing over the previous few years. The company has been consistently adding capacity to support its growing order book. It recently commenced two multi-purpose plants worth INR 3-3.5 bn. PI is aiming to achieve assets turnover 1.5x-2x. They are also planning to add two more multi-purpose facilities at Jambusar, over F22-F23E. We witnessed that PI&rsquo's fixed assets have grown sharply over the past few years, which will continue to guide higher CAPEX over the next few years. PI usually sets up a new plant only when the clients commit 70% of the new plant capacity. PI currently has 60 molecules in the pipeline. They have received >70 further inquiries, of which ~20% are in the non-agrochemical region.
A firm order book and upcoming production capabilities in Jambusar provide robust revenue visibility over the next 3 years with steady margins. We expect their CSM business revenue would grow at a rate of CAGR ~25% during F20-F23E.
Consistently launching new novel products to enhance domestic product portfolio
PI Industries Ltd has a 6% of market share and is a dominant player in the domestic agrochemicals market. The company focuses on introducing differentiated products in the domestic market, which gives a sustainable competitive advantage.
In the domestic agrochemical market, PI Industries follows an in-licensing model. The company in-licenses new molecules from global innovators and develops them into a strong brand proposition in the domestic market. In-licensed molecules are highly potential and are early-stage products for which PI enjoys exclusive market rights. The In-license business model allows the licensee to benefit from PI’s vast distribution network, and simultaneously, PI Industries Ltd gets the opportunity to launch new products in the domestic market exclusively. PI has built a long-standing relationship with its global innovators. It could provide an opportunity to introduce new products through an in-licensing model and allow co-marketing rights in early-stage products in India. The company also manufactures and markets branded generic products.
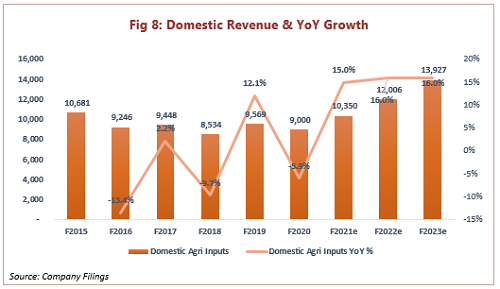
They have a unique product portfolio spanning more than 40 brands across herbicides, fungicides, insecticides, and specialty chemicals, including 6-8 in-licensed products and 10-12 co-marketed products. PI enjoys a higher margin compared to peers in the domestic market, mainly due to the higher portion of in-licensed and co-market products.
Substantial entry barriers to a unique business model
The industry faces a high entry barrier in India in the form of a lengthy registration process and 3-year complete data protection for the product. Over the years, the company has built a reputation through innovative products, property & data security, and a long-standing relationship with global innovators and deep farmer connections. Any company that wants to replicate the success of PI needs a significant amount of time and cost.
Innovatory product portfolio drives growth
The “ Nominee Gold” (Bypsyribac Sodium), a rice herbicide product launched by PI in Fy10, went a blockbuster product and generated the highest revenue and margin compared to its other products. But, once the exclusivity period ended for “ Nominee Gold” in Fy17, the product started facing healthy price competition. Earlier, the company imported the “ Nomine Gold,” which has now begun in-house production. We believe this should provide some more relief to face tighter competition.
The key drivers behind the success of PI are its effective products in the domestic market. The company has a niche product lineup at different registration stages from which they introduce 2-3 products every year before the Rabi and Kharif seasons. We witnessed the success of early-stage products like “ Nominee GOLD,” which brought a robust growth in a multi-year period.
In October 2019, PI launched a new wheat herbicide. The product is registered under the 9(3) category and in-licensed from Kumiai Chemicals. The management expected that the product has a strong potential. Also, it can be used on multiple crops. We believe that PI could replicate their success for “ Awkira”, and its sales will ramp up in the next 2-3 years.
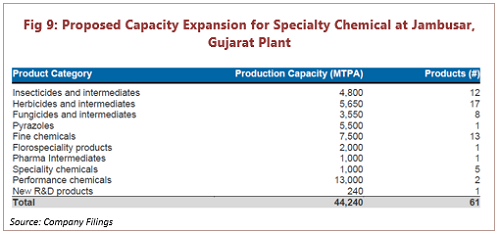
We expect a 15.7% revenue growth CAGR over F20-F23E led by new novel products and a favorable sectorial scenario.
Enters into Pharma and Specialty business, a high growth vertical
PI has announced its entry into the pharma CSM business in Feb 2020. They have already successfully developed and scaled up the intermediate used for COVID drugs. PI has started supplying two large customers based out of Japan and India from 1QFy21. Over the next 3-4 years, the company management aims to achieve double-digit revenue from the pharma CSM business. Management expects demand for the intermediates of pharma to grow expeditiously as the product commences in other countries. PI does not require any regulatory approvals as they are only manufacturing intermediates.
PI Industries Ltd is also looking to enter specialty chemicals segments like electronic chemicals, floor specialty, fine chemical, etc. It also looks to replicate its successful CSM business model-driven, by its process and technology in other different segments.
Inorganic path supports the growth
PI completed an acquisition of Isargo Asia in December 2019 worth of INR 3.5 bn. lsagro Asia was engaged in local distribution and agrochemical exports, with reported revenues of Rs3.1 bn, and a profit of Rs230m for FY19 where its domestic business contributed 65% of overall revenues, export business used to contribute 35%. It had two production plants for agrochemical technical grade manufacturing and one for formulations, spread across 30 acres, is adjacent to PI’s manufacturing unit in Panoli.
We see acquisition could unlock the synergies and accelerate growth momentum through improvement in plant utilization and efficiencies.
A strong earnings growth visibility
PI Industries is in a well-placed position for strong earnings growth over the next three years. We forecast overall revenues would clock at a CAGR of 25.7% over F20-F23E, driven by the CSM business. The company’s domestic business revenue would grow at a CAGR of 15.7% over F20-F23E on the back of new launches and ramp up the recently launched products. The CSM business is expected to continue its growth momentum and deliver a CAGR growth of 24.7% over F20-F23E, driven by a healthy order book. The growth of earnings will remain intact and is expected to grow at a CAGR of 28% over the F20-F23E, supported by strong revenue growth and seeing 290 bps improvement in EBITDA margin. EPS would grow at a CAGR of 27% over the period F20-F23E.
Outlook and Valuation
The unique business model of PI makes them well-positioned for growth. We believe a solid order book in CSM business and expectation of novel product launch and recently launched products in the domestic market would offer a predictable earnings growth. PI aims to deliver a healthy growth of revenue of 25.7% over F20-F23E. The operating margin improvement by 292 bps will lead to the EBITDA growth of 31% over F20-F23E, while PAT is expected to grow at a CAGR of 31.2% during the same period.
The company has raised INR 20 bn to fund inorganic growth and explored new verticals and its capacity expansion and utilization, which we believe.
The company enters into new verticals like, Pharmaceuticals, and Specialty Chemicals will act as crucial drivers for growth in the future.
We believe PI deserves the premium valuation compared to peers on the back of a unique model with higher growth prospects and growth potential in new verticals. However, we valued PI at PE of 40x F23E EPS and arrived price target of INR 2713.
Key Catalyst: Growth in new business (Pharma & Specialty Chemical) and recently launched new products.
Risk: A downturn in the global agrochemical market and competition in the domestic market.
PI Industries Key Financials
|
Income Statement |
F2019 |
F2020 |
F2021e |
F2022e |
F2023e |
|
Revenue |
28,409 |
33,665 |
41,882 |
53,824 |
66,920 |
|
Other Income |
595 |
489 |
601 |
662 |
728 |
|
Total Income |
29,004 |
34,154 |
42,483 |
54,486 |
67,647 |
|
COGS |
15,502 |
18,474 |
22,616 |
28,796 |
35,668 |
|
Gross Profit |
12,907 |
15,191 |
19,867 |
25,690 |
31,979 |
|
Employee Exp |
2,647 |
3,209 |
3,979 |
5,113 |
6,357 |
|
Other Expenses |
4,496 |
4,804 |
6,157 |
7,643 |
9,436 |
|
EBITDA |
5,764 |
7,178 |
9,732 |
12,934 |
16,186 |
|
D/A |
930 |
1,367 |
1,633 |
2,099 |
2,610 |
|
EBIT |
4,834 |
5,811 |
8,098 |
10,834 |
13,576 |
|
Fin. Cost |
50 |
170 |
327 |
420 |
522 |
|
share P/L of Associates & Jv |
- |
8 |
|||
|
PBT |
5,379 |
6,138 |
8,373 |
11,076 |
13,782 |
|
Tax Expenses |
1,277 |
1,572 |
2,110 |
2,791 |
3,473 |
|
PAT |
4,102 |
4,566 |
6,263 |
8,285 |
10,309 |
|
Basic EPS |
29.74 |
33.10 |
41.20 |
54.51 |
67.82 |
|
DPS |
3.60 |
3.60 |
7.00 |
10.90 |
13.56 |
|
Dividend Pay-out |
12% |
11% |
17.0% |
20.0% |
20.0% |
|
Segments |
F2019 |
F2020 |
F2021e |
F2022e |
F2023e |
|
Domestic Agri Inputs |
9,569 |
9,000 |
10,350 |
12,006 |
13,927 |
|
CSM |
18,840 |
24,660 |
30,332 |
38,218 |
47,773 |
|
Other (Pharma, Specialty) |
5 |
1,200 |
3,600 |
5,220 |
|
|
Total Revenue |
28,409 |
33,665 |
41,882 |
53,824 |
66,920 |
|
Domestic Agro Inputs |
33.7% |
26.7% |
24.7% |
22.3% |
20.8% |
|
CSM |
66.3% |
73.3% |
72.4% |
71.0% |
71.4% |
|
Other |
0.0% |
2.9% |
6.7% |
7.8% |
|
|
YoY |
|||||
|
Domestic agro Inputs |
12.1% |
-5.9% |
15.0% |
16.0% |
16.0% |
|
CSM YoY % |
29.5% |
30.9% |
23.0% |
26.0% |
25.0% |
|
Other |
23900.0% |
200.0% |
45.0% |
|
Balance sheet |
F2019 |
F2020 |
F2021e |
F2022e |
F2023e |
|
PPE |
11,791 |
17,338 |
23,338 |
26,338 |
29,338 |
|
CWIP |
1,544 |
2,371 |
2,371 |
2,371 |
2,371 |
|
Goodwill |
828 |
828 |
828 |
828 |
|
|
Other Intangibles Assets |
66 |
409 |
409 |
409 |
409 |
|
Intangible Assets underdevelopment |
284 |
336 |
336 |
336 |
336 |
|
Inv. Accounted for using equity method |
102 |
109 |
109 |
109 |
109 |
|
Investments |
70 |
70 |
70 |
70 |
70 |
|
Loans |
41 |
61 |
61 |
61 |
61 |
|
Others fin. Assets |
149 |
82 |
82 |
82 |
82 |
|
DTA |
141 |
- |
- |
- |
- |
|
Other Non-Curr Assets |
451 |
411 |
411 |
411 |
411 |
|
Total Non - Curr Assets |
14,639 |
22,015 |
28,015 |
31,015 |
34,015 |
|
Inventories |
5,357 |
7,989 |
9,294 |
11,834 |
14,658 |
|
Trade Receivables |
6,618 |
6,465 |
8,032 |
10,175 |
12,651 |
|
Investments |
1,119 |
1,325 |
1,325 |
1,325 |
1,325 |
|
CCE |
614 |
1,244 |
434 |
3,426 |
8,246 |
|
Bank Balance other than Cce |
278 |
98 |
98 |
98 |
98 |
|
Loans |
63 |
83 |
83 |
83 |
83 |
|
Other Financial Assets |
254 |
313 |
313 |
313 |
313 |
|
Contract Sales |
520 |
1,022 |
1,022 |
1,022 |
1,022 |
|
Current Tax Assets |
- |
146 |
146 |
146 |
146 |
|
Other Current Assets |
2,086 |
1,548 |
1,548 |
1,548 |
1,548 |
|
Total Current Assets |
16,909 |
20,233 |
22,295 |
29,970 |
40,090 |
|
Total Assets |
31,548 |
42,248 |
50,310 |
60,985 |
74,105 |
|
Long term Borrowings |
99 |
3,994 |
3,994 |
3,994 |
3,994 |
|
Other Financial Liabilities |
190 |
832 |
832 |
832 |
832 |
|
Provision |
290 |
124 |
124 |
124 |
124 |
|
DTL |
102 |
102 |
102 |
102 |
|
|
Total Non-Curr Liabilities |
579 |
5,052 |
5,052 |
5,052 |
5,052 |
|
Short term Borrowings |
- |
1,083 |
1,083 |
1,083 |
1,083 |
|
Trade Payables |
5,130 |
5,909 |
7,126 |
9,073 |
11,336 |
|
Other Financial Liabilities |
2,419 |
2,970 |
2,970 |
2,970 |
2,970 |
|
Provision |
126 |
424 |
424 |
424 |
424 |
|
Other Current Liabilities |
435 |
575 |
575 |
575 |
575 |
|
Current Tax Liabilities |
5 |
44 |
44 |
44 |
44 |
|
Total Current Liabilities |
8,115 |
11,005 |
12,222 |
14,169 |
16,432 |
|
Total Liabilities |
8,694 |
16,057 |
17,274 |
19,221 |
21,484 |
|
Share Capital |
138 |
138 |
152 |
152 |
152 |
|
Other Equity |
22,716 |
26,053 |
31,251 |
37,879 |
46,127 |
|
Total Equity |
22,854 |
26,191 |
31,403 |
38,031 |
46,279 |
|
Total Equity & Liabilities |
31,548 |
42,248 |
48,677 |
57,252 |
67,762 |
|
Cash Flow |
F2019 |
F2020 |
F2021e |
F2022e |
F2023e |
|
PBT |
5,379 |
6,138 |
8,373 |
11,076 |
13,782 |
|
D/A |
930 |
1,367 |
1,633 |
2,099 |
2,610 |
|
Fin. Cost |
50 |
170 |
327 |
420 |
522 |
|
Operating profit Before W.C |
6,594 |
7,774 |
10,333 |
13,595 |
16,914 |
|
(Inc.)/Dec in Trade Receivables |
-1,493 |
1,267 |
-1,567 |
-2,143 |
-2,476 |
|
(Inc.)/Dec in Inventories |
-837 |
-1,850 |
-1,305 |
-2,540 |
-2,824 |
|
Inc. / (Dec) in Current Provisions and Trade Payables |
1,498 |
319 |
1,217 |
1,947 |
2,263 |
|
Cash Generated from OP before Tax |
5,091 |
8,029 |
8,677 |
10,860 |
13,877 |
|
Income Tax Paid |
-1,183 |
-1,048 |
-2,110 |
-2,791 |
-3,473 |
|
CFO |
3,908 |
6,981 |
6,567 |
8,069 |
10,404 |
|
Capex |
-3,685 |
-6,743 |
-6,000 |
-3,000 |
-3,000 |
|
CFI |
-3,216 |
-9,851 |
-6,000 |
-3,000 |
-3,000 |
|
Proceeds from issue of Equity |
- |
- |
14 |
- |
- |
|
Interest Paid |
-50 |
-179 |
-327 |
-420 |
-522 |
|
Dividend Paid |
-831 |
-748 |
-1,065 |
-1,657 |
-2,062 |
|
CFF |
-1,251 |
3,500 |
-1,377 |
-2,077 |
-2,584 |
|
Net Cash Flow |
-559 |
630 |
-810 |
2,992 |
4,820 |
|
Effect of exchange differences on translation of Forex Cce |
- |
- |
- |
- |
- |
|
Net Inc./(Dec) in CCE |
-559 |
630 |
-810 |
2,992 |
4,820 |
|
Opening CCE |
1,173 |
614 |
1,244 |
434 |
3,426 |
|
Closing CCE |
614 |
1,244 |
434 |
3,426 |
8,246 |
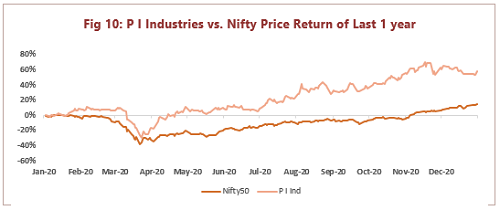
PI Industries Stock Performance
- Share :


Post a Comment
|
DISCLAIMER |
This report is only for the information of our customers. Recommendations, opinions, or suggestions are given with the understanding that readers acting on this information assume all risks involved. The information provided herein is not to be construed as an offer to buy or sell securities of any kind. ATS and/or its group companies do not as assume any responsibility or liability resulting from the use of such information.