Indian Oil Corporation Limited Research Report
|
Market Price |
Recommendation |
Target |
Time Horizon |
|
80.55 |
Buy |
109 |
1-Year |
Q3FY2023 REVIEW
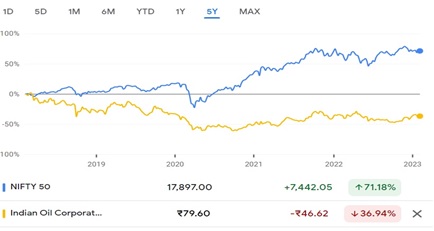
Indian Oil Corporation Limited reported net revenue of ₹2,32,303.20 crores for the quarter ended December 31, 2022, compared to ₹1,99,371.75 crores for December 30, 2021. Profit After Tax was ₹890.28 crores for the quarter ended December 31, 2022, compared to ₹6,261.40 crores during the corresponding quarter of the previous year, respectively.
STOCK DATA
|
52 Week H/L |
65.20/90.70 |
|
Market Cap (crores) |
1,13,746 |
|
Face Value (₹) |
10.00 |
|
Book Value |
147.18 |
|
EPS TTM |
27.34 |
|
NSE Code |
IOC |
Indian Oil Corporation Limited - OVERVIEW
-
At its Panipat refinery in northern India, Indian Oil will sign a memorandum of understanding with sustainable fuel technology vendor LanzaJet to start producing sustainable aviation fuel. The firm has a partnership with LanzaTech for the conversion of waste gas to ethanol, and LanzaJet, located in the United States, will support the conversion of ethanol to jet fuel. Sustainable aviation fuel will account for 2% of all aviation fuel by 2030.
-
To build infrastructure and promote green vehicle fuels, Indian Oil Corporation would invest ₹250 crores in the West Bengal area during the current fiscal year. Bengal is behind in ethanol supplies, according to the state-owned refiner and marketer of oil, which claims it has achieved ethanol blending of 7.5% in the state compared to the national average of 10%.
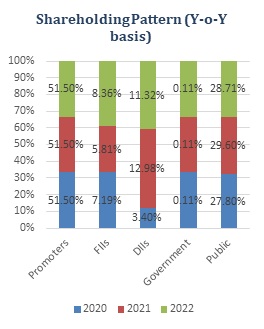
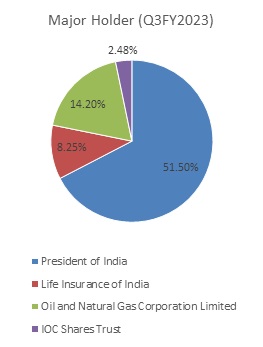
SHAREHOLDING PATTERN (%)
|
|
June-22 |
Sep-22 |
Dec-22 |
|
Promoter |
51.50 |
51.50 |
51.50 |
|
Public |
28.69 |
10.42 |
10.34 |
|
FII |
8.19 |
7.22 |
7.01 |
|
DII |
11.50 |
11.24 |
11.54 |
|
Governmemnt |
0.11 |
19.60 |
19.60 |
BENCHMARK COMPARISON
Beta: 0.66 |
Alpha: -5.10 |
Risk Reward Ratio: 1.24 |
Margin of Safety: 28% |
BUSINESS
-
Indian Oil Corporation Ltd. (IOCL) is India's premier Maharatna national oil firm, with commercial activities spanning the whole hydrocarbon value chain, from exploration and production of crude oil and gas through petrochemical manufacture, gas marketing, and the globalization of downstream operations.
-
The business runs refineries, pipelines, and marketing. Indane LPG, SERVO lubricants, XTRAPREMIUM gasoline, XTRAMILE diesel, Propel Petrochemicals, and several other names are among its range of brands.
-
IOC was established as Indian Oil Company Ltd. in 1959. Indian Refineries Ltd. and Indian Oil Corporation Ltd. amalgamated in 1964.
-
An integrated oil marketing and refining firm is IOCL. IOCL manages 11 refineries across India with a combined annual capacity of 80.6 million tonnes, or 32% of the nation's total capacity, together with its subsidiary, Chennai Petroleum Corporation Ltd.
-
Through a JV, IOCL is also building a 9 mmtpa refinery in Nagapattinam's Cauvery Basin, with an estimated project cost of Rs 31,580 crores. A joint venture (JV) is being created, in which IOCL and CPCL will each own 25% of the company—a 50% interest in the JV—while other seed investors will own the remaining 50%.
-
The non-convertible debentures (NCDs) of Indian Oil Corporation Limited (IOCL) have received a "CRISIL AAA/Stable" rating from CRISIL Ratings, and the company has also confirmed its "CRISIL AAA/Stable/CRISIL A1+" ratings on the bank facilities and other NCDs.
-
The company's market position is supported by its well-established marketing and distribution infrastructure, which as of October 31, 2022, included 35,268 retail stores and 12,838 LPG distributors.
-
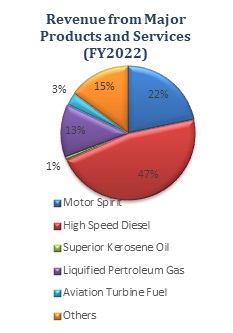
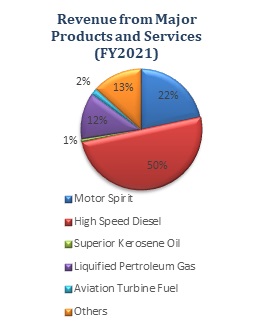
High-speed diesel (HSD) makes up 47% of sales as of FY2022, followed by the motor spirit (22%), liquefied petroleum gas (13%), aviation turbine fuel (3%), superior kerosene oil (1%), and other sources (14%), compared to 50%, 22%, 12%, 2%, 1%, and 13% in FY 2021.
-
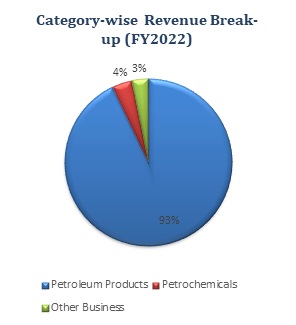
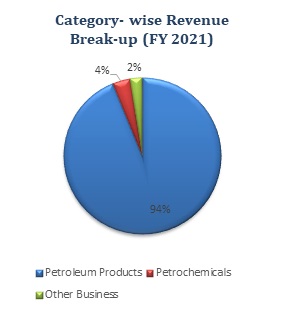
Revenue from petroleum products was 93%, from Petrochemicals was 4%, and other business was 3%, compared to 94%, 4%, and 2%.
-
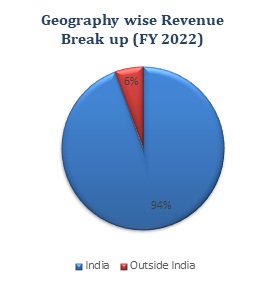
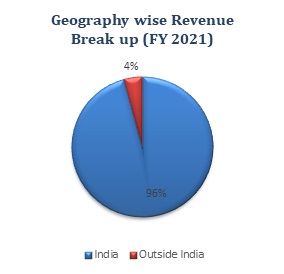
Geographically, revenue from India was 94% and from outside was 6%, compared to 96% and 4% in FY 2021.
SWOT ANALYSIS
STRENGTH
-
Several refineries.
-
Vast distribution network.
-
Strong brand name.
-
Support from the government of India.
WEAKNESS
-
Modest financial risk profile.
-
Volatility in crude oil prices.
-
FIIs have decreased their shareholding.
OPPORTUNITIES
-
Increasing natural gas market.
-
Global expansion.
-
Industry growth.
THREAT
-
Macroeconomics conditions.
-
Government regulations.
-
Environmental regulations.
OIL AND GAS INDUSTRY ANALYSIS
-
In FY 2021–22, India utilized 204.23 MMT of petroleum products and 63.9 BCM of natural gas, up 5.1% and 5% respectively from FY 2020–21. Compared to a 7% worldwide growth rate, India's oil demand is expected to increase by 50% to 7.2 MBD in 2030 from 4.8 MBD in 2019. In contrast to a 12% increase in world gas consumption, India's natural gas demand is expected to treble to 133 BCM in 2030 from 64 BCM in 2019.
-
Current estimates place India's conventional hydrocarbon resources at over 42 BMT of oil and oil equivalent gas (O+OEG), distributed over 26 sedimentary basins spanning an area of 3.36 million square kilometers.
-
There are now 83,027 retail gasoline stations overall, up from 45,104 in 2012. (2022). As of October 2022, this number has climbed to 84,614.
-
India has set a goal to increase the proportion of natural gas in its energy mix from roughly 6.7% to 15% by 2030.
-
India is the fourth-largest importer of liquefied natural gas and the third-largest user of energy and oil worldwide.
-
To fulfill the expanding local fuel demand as well as the export market, India expects to nearly quadruple its oil refining capacity to 450 MT over the next ten years. As of April 2022, India's refining capacity was estimated to be 251.2 MMTPA, with 23 refineries making 19 public, 3 private, and 1 joint venture refineries. For the years 2021–2022, refinery capacity utilisation will be about 96%. With a capacity of 70.1 MMTPA, Indian Oil Corporation (IOC) is the biggest refiner in the country.
-
From 221.77 MMT in 2020–21 to 241.7 MMT in 2021–22, the amount of crude oil processed grew by 9%.
-
One Nation, One Gas Grid: As of June 2022, the Gas Grid's total length of natural gas pipes was 22,306 km; of those, 13,029 km were still being built. By 2024–2025, India wants to increase pipeline coverage by 54%, reaching 34,500 km. By 2027, it is planned for all states to be joined by a national pipeline network. 221 Geographical Areas have been operationalized for the provision of CNG as of September 30, 2022.
-
From $ 21.4 Billion in the FY 2020–21 to $ 44.4 Billion in the FY 2021–22, the export of petroleum products climbed by 107.47%. Additionally, petroleum product exports from April to December 2022 were $70.28 billion, up 52.15% from the $46.19 billion exported from April to December 2021.
Indian Oil Corporation Limited - FINANCIAL OVERVIEW
QUARTERLY SUMMARY
|
Quarterly (INR in crores) |
Dec-22 |
Sep-22 |
Jun-22 |
Mar-22 |
Dec-21 |
|
Revenue from Operations |
2,32,303.20 |
2,33,013.56 |
2,55,381.62 |
2,09,049.16 |
1,99,371.75 |
|
Other income |
1,573.26 |
787.42 |
622.98 |
580.70 |
1,146.73 |
|
Total Income |
2,33,876.46 |
2,33,800.98 |
2,56,004.60 |
2,09,629.86 |
2,00,518.48 |
|
|
|
|
|
|
|
|
Total Expenditure |
2,31,450.37 |
2,33,019.83 |
2,53,121.44 |
1,98,068.47 |
1,91,713.69 |
|
EBIT |
2,426.09 |
781.15 |
2,883.16 |
11,561.39 |
8,804.79 |
|
|
|
|
|
|
|
|
Finance cost |
2,122.07 |
1,554.43 |
1,907.50 |
1,806.48 |
1,119.07 |
|
EBT before Share of Profits/(Loss) of Associate and Joint Ventures |
304.02 |
-773.28 |
975.66 |
9,754.91 |
7,685.72 |
|
|
|
|
|
|
|
|
Share of Profits/(Loss) of Associate and Joint Ventures |
158.06 |
246.67 |
367.95 |
136.51 |
330.34 |
|
PBT |
462.08 |
-526.61 |
1,343.61 |
9,891.42 |
8,016.06 |
|
|
|
|
|
|
|
|
Tax Expenses |
-428.20 |
383.60 |
460.65 |
2,802.24 |
1,754.66 |
|
PAT |
890.28 |
-910.21 |
882.96 |
7,089.18 |
6,261.40 |
Indian Oil Corporation Limited - PROFIT AND LOSS STATEMENT (₹ IN Crores)
|
|
Mar-19 |
Mar-20 |
Mar-21 |
Mar-22 |
|
Revenue from Operations |
6,17,251.41 |
5,75,989.70 |
5,20,236.84 |
7,36,730.84 |
|
Other Income |
2,714.28 |
2,773.62 |
3,499.54 |
3,082.22 |
|
Total Income |
6,19,965.69 |
5,78,763.32 |
5,23,736.38 |
7,39,813.06 |
|
|
|
|
|
|
|
Cost of Goods sold |
4,42,096.76 |
4,15,129.50 |
2,75,102.54 |
4,86,952.90 |
|
Gross Profit |
1,77,868.93 |
1,63,633.82 |
2,48,633.84 |
2,52,860.16 |
|
|
|
|
|
|
|
Excise Duty |
89,093.91 |
92,226.67 |
1,56,287.17 |
1,47,395.10 |
|
Employee Benefits Expense |
11,596.28 |
9,336.93 |
11,308.78 |
11,582.92 |
|
Other Expenses |
39,237.57 |
43,064.76 |
35,833.65 |
43,330.47 |
|
EBITDA |
37,941.17 |
19,005.46 |
45,204.24 |
50,551.67 |
|
|
|
|
|
|
|
Depreciation and Amortisation and Impairment Expense: |
|
|
|
|
|
Property, Plant and Equipment |
8,240.07 |
9,586.70 |
10,643.34 |
11,986.15 |
|
Intangible |
266.38 |
686.69 |
298.11 |
361.43 |
|
Impairment Loss |
0.93 |
-613.94 |
1,111.98 |
-444.98 |
|
Net Loss on De-Recognition of Financial Assets at Amortised Cost |
3.29 |
5.73 |
7.69 |
172.75 |
|
EBIT |
29,430.50 |
9,340.28 |
33,143.12 |
38,476.32 |
|
|
|
|
|
|
|
Finance Costs |
4,887.98 |
6,578.74 |
3,589.12 |
5,423.26 |
|
EBT before Share of Profit/(Loss) of Associate/Joint Venture |
24,542.52 |
2,761.54 |
29,554.00 |
33,053.06 |
|
|
|
|
|
|
|
Share of Profit/(Loss) of Associate/ Joint Venture |
1,384.38 |
1,366.09 |
1,196.73 |
1,235.56 |
|
EBT Exceptional Items |
25,926.90 |
4,127.63 |
30,750.73 |
34,288.62 |
|
|
|
|
|
|
|
Exceptional Items |
- |
-11,304.64 |
- |
- |
|
EBT |
25,926.90 |
-7,177.01 |
30,750.73 |
34,288.62 |
|
|
|
|
|
|
|
Tax Expense |
8,653.05 |
-5,300.69 |
8,988.51 |
8,562.02 |
|
PAT before Non-Controlling Interest |
17,273.85 |
-1,876.32 |
21,762.22 |
25,726.60 |
|
|
|
|
|
|
|
Non-Controlling Interest |
-102.85 |
-2,769.46 |
124.01 |
624.37 |
|
PAT |
17,376.70 |
-893.14 |
21,638.21 |
25,102.23 |
|
|
|
|
|
|
|
EPS |
|
|
|
|
|
Basic |
18.41 |
-0.97 |
23.57 |
27.34 |
|
Diluted |
18.41 |
-0.97 |
23.57 |
27.34 |
Indian Oil Corporation Limited - Balance Sheet (₹ in Crores)
|
|
Mar-19 |
Mar-20 |
Mar-21 |
Mar-22 |
|
ASSETS: |
|
|
|
|
|
Non-Current Assets: |
|
|
|
|
|
Property, Plant and Equipment |
1,29,647.12 |
1,44,076.30 |
1,53,698.39 |
1,57,194.98 |
|
Capital Work-in-Progress |
23,401.01 |
29,628.86 |
32,953.16 |
44,049.82 |
|
Goodwill |
1.04 |
1.04 |
1.04 |
1.04 |
|
Intangible Assets |
2,845.60 |
2,944.79 |
3,385.36 |
3,318.33 |
|
Intangible Assets Under Development |
4,879.73 |
3,215.98 |
3,337.38 |
3,419.45 |
|
Equity Investments in Joint Ventures and Associates |
11,893.40 |
13,572.23 |
15,010.12 |
16,335.00 |
|
Financial Assets: |
|
|
|
|
|
Investments |
23,699.66 |
13,707.46 |
20,424.09 |
28,003.76 |
|
Loans |
2,301.87 |
3,294.66 |
2,447.43 |
2,292.96 |
|
Other Financial Assets |
1,586.22 |
1,430.85 |
2,120.25 |
2,639.28 |
|
Income Tax Assets |
1,393.33 |
4,236.20 |
2,479.91 |
2,819.51 |
|
Other Non-Current Assets |
3,943.23 |
2,893.18 |
2,851.09 |
3,690.03 |
|
Total Non-Current Assets |
2,05,592.21 |
2,19,001.55 |
2,38,708.22 |
2,63,764.16 |
|
|
|
|
|
|
|
Current Assets: |
|
|
|
|
|
Inventories |
77,126.48 |
67,010.76 |
83,427.46 |
1,11,736.51 |
|
Financial Assets: |
|
|
|
|
|
Investments |
8,519.19 |
8,291.18 |
9,282.61 |
8,013.20 |
|
Trade Receivables |
15,807.53 |
13,259.48 |
13,782.16 |
18,700.42 |
|
Cash and Cash Equivalents |
933.09 |
1,434.61 |
781.19 |
1,176.59 |
|
Other Bank Balances |
127.88 |
861.37 |
1,693.49 |
643.55 |
|
Loans |
1,578.59 |
1,089.64 |
612.29 |
450.92 |
|
Other Financial Assets |
20,382.64 |
14,340.19 |
2,876.95 |
1,509.22 |
|
Current Tax Assets |
481.92 |
55.62 |
- |
- |
|
Other Current Assets |
4,379.89 |
4,157.20 |
3,558.65 |
3,842.03 |
|
Total Current Assets |
1,29,337.21 |
1,10,500.05 |
1,16,014.80 |
1,46,072.44 |
|
|
|
|
|
|
|
Asset Held for Sale |
227.40 |
235.23 |
192.90 |
788.25 |
|
|
|
|
|
|
|
Total Assets |
3,35,156.82 |
3,29,736.83 |
3,54,915.92 |
4,10,624.85 |
|
|
|
|
|
|
|
EQUITY AND LIABILITIES: |
|
|
|
|
|
Equity: |
|
|
|
|
|
Equity Share Capital |
9,181.04 |
9,181.04 |
9,181.04 |
9,181.04 |
|
Other Equity |
1,03,288.20 |
86,216.87 |
1,02,657.01 |
1,24,354.14 |
|
Total Equity before Non-Controlling Interest |
1,12,469.24 |
95,397.91 |
1,11,838.05 |
1,33,535.18 |
|
|
|
|
|
|
|
Non-Controlling Interest |
1,877.36 |
876.27 |
975.94 |
1,591.47 |
|
Total Equity |
1,14,346.60 |
96,274.18 |
1,12,813.99 |
1,35,126.65 |
|
|
|
|
|
|
|
Liabilities: |
|
|
|
|
|
Non-Current Liabilities: |
|
|
|
|
|
Financial Liabilities: |
|
|
|
|
|
Borrowings |
39,152.45 |
56,070.61 |
54,685.01 |
55,944.54 |
|
Lease Liabilities |
- |
- |
6,249.89 |
6,363.62 |
|
Other Financial Assets |
616.03 |
789.58 |
847.48 |
913.79 |
|
Provisions |
2,211.99 |
1,597.23 |
1,596.83 |
1,586.59 |
|
Deferred Tax Liabilities |
16,509.71 |
11,439.29 |
13,964.47 |
15,354.37 |
|
Other Non-Current Liabilities |
1,599.45 |
2,048.10 |
2,583.36 |
3,180.59 |
|
Total Non-Current Liabilities |
60,089.63 |
71,944.81 |
79,927.04 |
83,343.50 |
|
|
|
|
|
|
|
Current Liabilities: |
|
|
|
|
|
Financial Liabilities: |
|
|
|
|
|
Borrowings |
53,559.29 |
69,897.44 |
54,241.27 |
67,605.56 |
|
Lease Liabilities |
- |
- |
1,472.89 |
2,105.87 |
|
Trade Payables: |
|
|
|
|
|
Total Outstanding Dues of Micro and Small Enterprises |
236.82 |
205.56 |
556.39 |
806.63 |
|
Other Creditors |
40,957.30 |
27,370.70 |
36,407.68 |
48,239.28 |
|
Other Financial Liabilities |
43,317.75 |
41,939.63 |
42,122.01 |
44,024.79 |
|
Other Current Liabilities |
12,475.38 |
12,468.24 |
17,141.77 |
18,979.61 |
|
Provisions |
10,174.05 |
9,636.27 |
9,430.36 |
9,748.59 |
|
Current Tax Liabilities |
- |
- |
802.52 |
619.31 |
|
Total Current Liabilities |
1,60,720.59 |
1,61,517.84 |
1,62,174.89 |
1,92,129.64 |
|
|
|
|
|
|
|
Liabilities Directly Associated with the Assets Held for Sale |
- |
- |
- |
25.06 |
|
|
|
|
|
|
|
Total Equity & Liabilities |
3,35,156.82 |
3,29,736.83 |
3,54,915.92 |
4,10,624.85 |
Indian Oil Corporation Limited - Cash Flow Statement (₹ in Crores)
|
|
Mar-19 |
Mar-20 |
Mar-21 |
Mar-22 |
|
Net Profit Before Tax |
25,926.90 |
-7,177.01 |
30,750.73 |
34,288.62 |
|
Net Cash from Operating Activities |
12,746.52 |
7,146.25 |
49,650.22 |
24,570.33 |
|
Net Cash Used for Investing Activities |
-22,568.61 |
-29,100.76 |
-22,934.67 |
-21,177.64 |
|
Net Cash From (Used For) Financing Activities |
10,436.45 |
22,456.03 |
-27,368.97 |
-2,997.29 |
|
Net Increase in Cash and Cash Equivalents |
614.36 |
501.52 |
-653.42 |
395.40 |
|
Cash And Cash Equivalents at The Beginning of The Year |
318.73 |
933.09 |
1,434.61 |
781.19 |
|
Cash And Cash Equivalents at The End of the Year |
933.09 |
1,434.61 |
781.19 |
1,176.59 |
Indian Oil Corporation Limited - Ratio Analysis
|
|
Mar-19 |
Mar-20 |
Mar-21 |
Mar-22 |
|
Profitability Ratio |
|
|
|
|
|
Gross Profit |
28.82% |
28.41% |
47.79% |
34.32% |
|
EBITDA Margin |
6.15% |
3.30% |
8.69% |
6.86% |
|
EBIT Margin |
4.77% |
1.62% |
6.37% |
5.22% |
|
Pre-Tax Margin |
3.98% |
0.48% |
5.68% |
4.49% |
|
Net Profit Margin |
2.80% |
-0.33% |
4.18% |
3.49% |
|
|
|
|
|
|
|
Return on Investment |
|
|
|
|
|
Return on Asset – ROA |
5% |
-1% |
6% |
7% |
|
Return on Capital Employed – ROCE |
18% |
5% |
18% |
19% |
|
Return on Equity – ROE |
15% |
-2% |
21% |
20% |
|
|
|
|
|
|
|
Liquidity Ratio (x) |
|
|
|
|
|
Current ratio |
0.80 |
0.68 |
0.72 |
0.76 |
|
Quick Ratio |
0.32 |
0.27 |
0.20 |
0.18 |
|
|
|
|
|
|
|
Turnover Ratio |
|
|
|
|
|
Receivables Turnover |
7.8 |
9.2 |
9.5 |
8.0 |
|
Inventory Turnover |
61.0 |
63.4 |
99.8 |
73.1 |
|
Payables Turnover |
31.9 |
30.0 |
42.3 |
31.7 |
|
Asset Turnover |
2.0 |
1.7 |
1.5 |
1.9 |
|
|
|
|
|
|
|
Solvency Ratio |
|
|
|
|
|
Debt to Equity |
0.35 |
0.59 |
0.49 |
0.42 |
|
Interest Coverage Ratio |
6 |
1 |
9 |
7 |
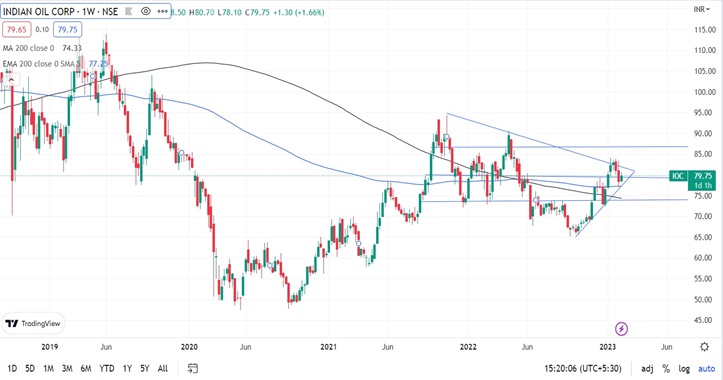
Indian Oil Corporation Limited - Technical Analysis
-
Stock is trading above Moving Average 200 Days with a support level of ₹74 and a resistance level of ₹86.
-
Stock is on an upward trend on the weekly and Monthly chart.
-
One can accumulate this stock at current levels.
Recommendation Rationale
-
Dominant position in the domestic refining and Marketing business:
-
The market for oil marketing and refining is dominated by OCL. As of October 31, 2022, the corporation had 11 refineries, making about 32% of India's total capacity, and in the fiscal year 2022, it controlled around 42% of the market for petroleum products.
-
Operational efficiency is increased by large, integrated operations, regionally varied refining capacity, and high utilisation.
-
-
The GoI's strategic relevance in the domestic energy industry:
-
IOC has significant economic importance as India's major oil refining and marketing enterprise. Because it helps the government achieve its socioeconomic goals by regulating the pricing of sensitive goods like subsidized liquefied petroleum gas (LPG) and better kerosene oil, the firm is of strategic significance to the government of India (SKO).
-
-
Diversifying the refineries' geographic basis:
-
In addition to owning and operating nine refineries scattered around the nation, the business also holds a majority position in Chennai Petroleum Corporation Limited (CPCL), giving it influence over two more refineries, bringing the total number of refineries under its control to eleven.
-
Its nine refineries are distributed across six inland locations.
-
-
Considerable liquidity and financial flexibility:
-
IOC continues to have significant financial flexibility, which has allowed it to borrow money at favourable rates from the local and international banking systems and capital markets to cover its significant working capital needs and for project financing.
-
The strong parentage of IOC that results from the GoI owning 51.50% of the company supports this.
-
-
Vulnerability to fluctuations in the price of crude oil:
-
Over the last few years, the price of crude oil has fluctuated greatly. Crude oil prices rose to over $100 per barrel during the first quarter of the current fiscal, before normalising to approximately $ 85 per barrel by the third quarter of the current fiscal year 2023. Since IOCL imports 80–85% of its crude oil needs, it is still vulnerable to fluctuations in the rupee-dollar exchange rate and an associated rise in the cost of imports. The ability of IOCL to continue compensating for these volatilities through the marketing margin will be an important factor to watch.
-
Valuation
-
Indian Oil Corporation Limited has shown revenue growth of 9% CAGR for FY2018-2022.
-
The company’s net profit has shown a growth of 3% CAGR for FY2018-2022.
-
The company’s ROE and ROCE are 20% & 19% for FY2022.
-
The company has low debt.
-
We anticipate the company could generate higher revenue for the following FY 2023, comparable to the prior year, based on the company's present performance in FY 2022.
-
We used data from the last five years (2018-2022) to anticipate revenue for the fiscal years 2023–2027.
Estimated Income Statement (₹ in crores)
|
|
Mar-23 |
Mar-24 |
Mar-25 |
Mar-26 |
Mar-27 |
|
|
2023-E |
2024-E |
2025-E |
2026-E |
2027-E |
|
Revenue |
8,08,898.84 |
8,84,436.18 |
9,67,027.56 |
10,57,331.74 |
11,56,069.01 |
|
COGS |
5,32,412.42 |
5,82,115.82 |
6,36,459.28 |
6,95,875.98 |
7,60,839.53 |
|
Gross Profit |
2,76,486.42 |
3,02,320.36 |
3,30,568.28 |
3,61,455.76 |
3,95,229.48 |
|
Excise Duty |
193322.02 |
193784.72 |
221488.77 |
236910.51 |
261900.29 |
|
Employee Expenses |
15,087.09 |
16,495.55 |
18,035.49 |
19,719.20 |
21,560.09 |
|
Other Expenses |
51,429.30 |
56,230.49 |
61,479.89 |
67,219.35 |
73,494.61 |
|
EBITDA |
16,648.01 |
35,809.60 |
29,564.13 |
37,606.71 |
38,274.48 |
|
Depreciation |
13,441.99 |
12,658.25 |
11,837.19 |
11,807.05 |
11,504.12 |
|
EBIT |
3,206.02 |
23,151.36 |
17,726.94 |
25,799.65 |
26,770.36 |
|
Financial Cost |
451.89 |
3,263.20 |
2,498.62 |
3,636.48 |
3,773.30 |
|
EBT |
2,754.13 |
19,888.16 |
15,228.32 |
22,163.18 |
22,997.06 |
|
Tax expenses |
688.53 |
4,972.04 |
3,807.08 |
5,540.79 |
5,749.27 |
|
PAT |
2,065.60 |
14,916.12 |
11,421.24 |
16,622.38 |
17,247.80 |
Disclaimer: This report is only for the information of our customer Recommendations, opinions, or suggestions are given with the understanding that readers acting on this information assume all risks involved. The information provided herein is not to be construed as an offer to buy or sell securities of any kind.
- Share :


Post a Comment
|
DISCLAIMER |
This report is only for the information of our customers. Recommendations, opinions, or suggestions are given with the understanding that readers acting on this information assume all risks involved. The information provided herein is not to be construed as an offer to buy or sell securities of any kind. ATS and/or its group companies do not as assume any responsibility or liability resulting from the use of such information.