IDFC FIRST Bank Limited Research Report
|
Industry |
Market Price |
Recommendation |
Target |
Time Horizon |
|
Bank |
46.05 |
Buy |
55 |
1-Year |
Q1 FY 2023 Review
IDFC First Bank reported net revenue of ₹4,08,930 Lakhs for the quarter ended June 30, 2022, compared to ₹4,92,174 lakhs for June 30, 2021. Profit After Tax was ₹48,501 lakhs for the quarter ended June 30, 2022, as compared to (₹62,117) lakhs during the corresponding quarter of the previous year, respectively.
IDFC FIRST Bank - Investment Summary
|
CMP (₹) |
46.05 |
|
52 Week H/L |
28.95/53.50 |
|
Market Cap (crores) |
28,644 |
|
Face Value (₹) |
10.00 |
|
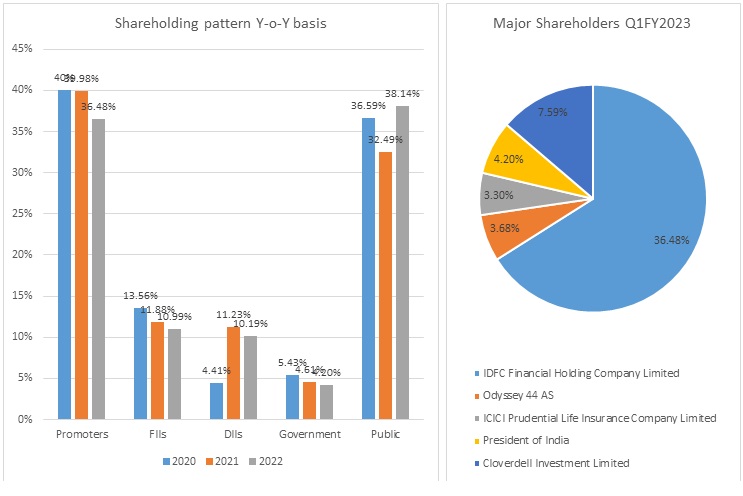
Promoter Holding (%) |
36.48 |
|
Non-Promoter Holding (%) |
63.52 |
|
Total (%) |
100.00 |
|
Book Value |
₹33.91 |
|
EPS TTM |
₹0.21 |
Overview
-
IDFC First Bank is engaged in the business of banking services.
-
As of June 30, 2022, the bank has 651 branches and 807 ATMs across India.
-
Bank has been assigned AA stable and A1+ on the existing debt instruments by Crisil Rating Agency.
-
Allotment of 9,95,540 equity shares of the face value of ₹10 each to eligible employees under the stock option scheme.
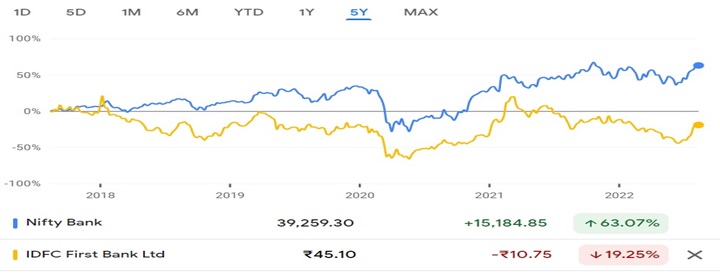
Beta: 1.39 |
Alpha: -13.9 |
Risk Reward Ratio: 1.37 |
Margin of Safety: 20% |
IDFC FIRST Bank -Quarterly Summary
|
Quarterly (INR in crores) |
Jun-22 |
Mar-22 |
Dec-21 |
Sep-21 |
Jun-21 |
|
Interest Income |
4,922 |
4,554 |
4,429 |
4,101 |
4,089 |
|
Interest Expended |
2,170 |
1,884 |
1,849 |
1,828 |
1,904 |
|
Net Interest Income |
2,751 |
2,669 |
2,580 |
2,272 |
2,186 |
|
|
|
|
|
|
|
|
Other Income |
856 |
831 |
769 |
730 |
842 |
|
Total Income |
3,607 |
3,501 |
3,350 |
3,002 |
3,028 |
|
|
|
|
|
|
|
|
Employee Cost |
956 |
897 |
824 |
732 |
647 |
|
Other Expenses |
1,693 |
1,764 |
1,742 |
1,616 |
1,375 |
|
Provision and Contingencies |
308 |
369 |
392 |
475 |
1,872 |
|
EBT |
650 |
470 |
391 |
179 |
(865) |
|
|
|
|
|
|
|
|
Tax Expenses |
165 |
118 |
101 |
68 |
(244) |
|
PAT |
485 |
352 |
290 |
111 |
(621) |
Business
-
IDFC First Bank came into effect on December 18, 2018, after the merger of IDFC Bank Limited and Capital First Limited.
-
About IDFC Bank Limited:
-
IDFC Bank was initially established as IDFC Limited in 1994 to facilitate infrastructure finance in the country.
-
In 2014, IDFC Limited got a banking license from RBI and IDFC Bank launched operations on October 01, 2015.
-
Post-conversions to the bank, all the lending business of IDFC Limited was transferred to IDFC Bank.
-
-
About Capital First:
-
Mr. V Vaidyanathan started Capital First limited in 2012 after acquiring an existing non-banking financial company through a management buyout (MBO) backed by private equity.
-
Before MBO, the NBFC was primarily engaged in corporate lending but transformed into a retail lender with a focus on consumer and small and medium enterprise segments after the buyout.
-
The MBO turned around the company from losses of ₹32 crores in FY 2010 to a net profit of ₹327 crores in FY 2018.
-
The asset under management of Capital First Limited grew at a CAGR of 29% over 5 years till March 2018, while profit grew at a 5-year CAGR of 56%.
-
-
Post-merger, IDFC Bank and Capital First Limited and its subsidiaries were renamed as IDFC First Bank Limited.
-
During the initial quarters of the post-merger, the bank recognized the financial troubles they faced because of legacy accounts and provided the provision for the same. They also invested in expanding their reach to build up a strong retail franchise.
-
IDFC First Bank’s operation span across various business segments comprising:
-
Treasury:
-
The treasury segment primarily consists of the group’s investment portfolio, money market borrowing and lending, operations, and foreign exchange and derivatives portfolio of the bank.
-
Revenue of the treasury segment consists of interest income on the investment portfolio, inter-segment revenue, gains or losses from trading operations, trades, and capital market deals.
-
-
Corporate/ Wholesale Banking:
-
The wholesale banking segment provides loans, non-funded facilities, loan syndication, and transaction services to corporate relationships non-included under retail banking.
-
Revenue from the wholesale banking segment consists of interest earned on loans to customers, inter-segment revenue, interest/ fees earned on transaction services, earnings from trade services, fees on client FX & derivatives, and other non-funded facilities.
-
-
Retail Banking:
-
Retail Banking constitutes lending to individuals/ business banking customers through the branch network and other delivery channels subject to the orientation, nature of the product, the granularity of the exposures, and the quantum thereof.
-
Revenue of the retail banking segment is derived from interest earned on retail loans, inter-segment revenue and fees from services rendered, fees on client FX & derivatives, and other non-funded facilities.
-
-
Other Banking Business:
-
This segment includes revenue from the distribution of third-party products.
-
-
-
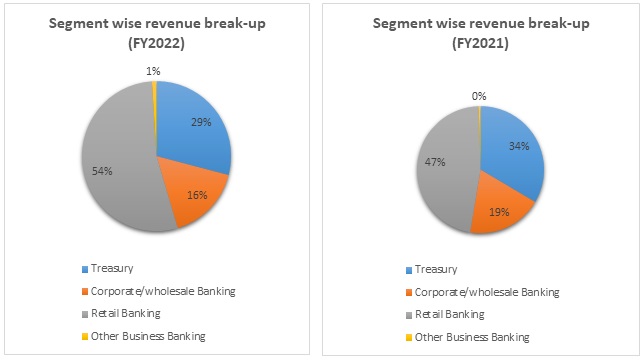
Out of the total revenue, 29% has been generated from Treasury operations, 16% from Corporate/wholesale Banking, 54% from Retail Banking, and 1% from others in FY 2022 compared to 34%, 19%, 47%, and 0% in FY 2021, respectively.
IDFC FIRST Bank - Revenue Trend
IDFC FIRST Bank - Ratio Analysis
|
|
Mar-19 |
Mar-20 |
Mar-21 |
Mar-22 |
|
Net Interest Income |
2.07% |
4.03% |
4.53% |
5.11% |
|
Gross NPA |
2.43% |
2.60% |
4.15% |
3.70% |
|
Net NPA |
1.27% |
0.94% |
1.86% |
1.53% |
|
Provision Coverage Ratio |
48.18% |
64.53% |
63.57% |
70.29% |
|
Capital Adequacy Ratio |
15.00% |
13.38% |
13.77% |
16.74% |
|
CASA Ratio |
12.87% |
32.16% |
51.77% |
48.41% |
|
ROA |
(1.14%) |
(1.90%) |
0.06% |
0.29% |
|
ROE |
(11.23%) |
(16.92%) |
2.90% |
0.68% |
IDFC FIRST Bank - Financial Overview
IDFC FIRST Bank - Profit and Loss Statement (₹ in crores)
|
|
Mar-18 |
Mar-19 |
Mar-20 |
Mar-21 |
Mar-22 |
|
Interest income |
9,098 |
12,204 |
16,240 |
15,968 |
17,173 |
|
Interest Expended |
7,126 |
8,743 |
10,228 |
8,585 |
7,465 |
|
Net Income |
1,973 |
3,461 |
6,012 |
7,383 |
9,708 |
|
|
|
|
|
|
|
|
Other income |
1,120 |
852 |
1,722 |
2,211 |
3,173 |
|
Total income |
3,092 |
4,313 |
7,734 |
9,594 |
12,880 |
|
|
|
|
|
|
|
|
Other expenses |
1,797 |
6,091 |
5,765 |
7,053 |
9,597 |
|
Provision and Contingencies |
340 |
102 |
4,813 |
2,058 |
3,151 |
|
PAT before Share in Profit/ Loss of Associates |
955 |
(1,880) |
(2,843) |
483 |
132 |
|
|
|
|
|
|
|
|
Share in Profit/Loss of Associates |
(76) |
(28) |
0 |
0 |
0 |
|
PAT |
880 |
(1,908) |
(2,843) |
483 |
132 |
|
|
|
|
|
|
|
|
EPS |
|
|
|
|
|
|
Basic |
2.59 |
(4.66) |
(5.94) |
0.88 |
0.21 |
|
Diluted |
2.58 |
(4.63) |
(5.86) |
0.87 |
0.21 |
|
|
|
|
|
|
|
|
Number of shares |
|
|
|
|
|
|
Basic |
340.18 |
409.09 |
478.64 |
550.26 |
620.31 |
|
Diluted |
341.13 |
412.49 |
484.88 |
557.58 |
628.18 |
IDFC FIRST Bank - Cash Flow Statement (₹ in lakhs)
|
|
Mar-18 |
Mar-19 |
Mar-20 |
Mar-21 |
Mar-22 |
|
Net Profit Before Tax |
1,059.61 |
(3,237.43) |
(2,345.89) |
518.98 |
174.97 |
|
Net Cash from Operating Activities |
(5,977.82) |
17,363.78 |
10,965.54 |
14,041.71 |
2,679.13 |
|
Net Cash Used for Investing Activities |
(1,027.28) |
(1,364.74) |
(3,790.19) |
(2,833.25) |
(2,960.47) |
|
Net Cash From (Used For) Financing Activities |
6,741.79 |
(12,220.31) |
(12,538.66) |
(9,598.18) |
10,210.59 |
|
Net Increase in Cash and Cash Equivalents |
(263.31) |
3,778.72 |
(5,363.31) |
1,610.28 |
9,929.25 |
|
Cash And Cash Equivalents at The Beginning of the Year |
5,140.13 |
4,876.82 |
9,526.15 |
4,162.84 |
5,773.12 |
|
Cash And Cash Equivalents at The End of the Year |
4,876.82 |
9,526.15 |
4,162.84 |
5,773.12 |
15,702.37 |
IDFC FIRST Bank - Balance Sheet (₹ in crores)
|
|
Mar-18 |
Mar-19 |
Mar-20 |
Mar-21 |
Mar-22 |
|
CAPITAL AND LIABILITIES: |
|
|
|
|
|
|
Capital |
3,404.07 |
4,781.68 |
4,809.90 |
5,675.85 |
6,217.71 |
|
Reserves and Surplus |
11,870.03 |
13,417.69 |
10,593.62 |
12,223.77 |
14,848.29 |
|
Minority Interest |
- |
- |
- |
0.10 |
16.12 |
|
Deposits |
48,039.44 |
70,353.59 |
65,078.94 |
88,536.24 |
1,05,539.63 |
|
Borrowings |
57,287.07 |
69,983.39 |
57,397.19 |
45,786.09 |
52,962.60 |
|
Other Liabilities and Provisions |
5,781.38 |
8,562.59 |
11,278.90 |
10,849.48 |
10,561.39 |
|
Total |
1,26,381.99 |
1,67,098.93 |
1,49,158.55 |
1,63,071.52 |
1,90,145.73 |
|
|
|||||
|
ASSETS: |
|||||
|
Cash and Balances with Reserve Bank of India |
3,021.10 |
4,100.93 |
3,348.42 |
4,669.55 |
5,664.25 |
|
Balances with Banks and Money at Call and Short Notice |
1,855.72 |
5,425.22 |
814.42 |
1,103.58 |
10,038.12 |
|
Investments |
60,904.42 |
58,245.23 |
45,174.42 |
45,181.59 |
45,934.56 |
|
Advances |
52,164.89 |
86,302.29 |
85,595.36 |
1,00,550.13 |
1,17,857.80 |
|
Fixed Assets |
800.26 |
974.04 |
1,073.23 |
1,295.93 |
1,387.34 |
|
Other Assets |
7,635.61 |
12,051.22 |
13,152.69 |
10,131.09 |
9,123.99 |
|
Goodwill on Consolidation |
- |
- |
- |
139.67 |
139.67 |
|
Total |
1,26,381.99 |
1,67,098.93 |
1,49,158.55 |
1,63,071.52 |
1,90,145.73 |
Industry Overview
-
The asset quality of the banking has improved, with the GNPA ratio declining from 7.4% in March 2021 to a six-year low of 5.9% in March 2022.
-
NNPA ratio fell during 2021-22 and stood at 1.7% banks have reduced the NNPA ratio through recoveries, write-offs, and reduction.
-
The stress test indicates that the GNPA ratio of all banks may improve from 5.9% in March 2022 to 5.3% by March 2023 under the baseline scenario driven by higher expected bank credit growth and a declining trend in the stocks of GNPA, as per Financial Stability Report (FSR).
-
If the Macroeconomics environment worsens, the GNPA ratio may rise from 6.2% to 8.3%, as per FSR.
-
The provisioning coverage ratio improved from 67.6% in March 2021 to 70.9% in March 2022.
-
Across all bank groups, the Slippage ratio, which calculates the new addition to NPAs as a percentage of standard advances at the beginning of the year, decreased in FY 2022.
-
Write-off fell for the second year running to 20% in FY 2022.
-
Innovative banking formats, such as payments and small finance banks, have lately been introduced to the Indian banking industry. The new step from the RBI could significantly aid in the restructuring of the local banking sector.
-
The digital payment systems in India have evolved among 25 countries, with India’s Immediate Payment Services (IMPS) being the only system at level five in the Faster Payments Innovation Index (FPII).
-
As of September 2021, the Indian Banking System consists of 12 public sector, 22 private sector, 46 foreign, 56 regional, 1485 urban, and 96,000 rural co-operative banks, as well as co-operative lending institutions.
-
As of February 21, 2022, the number of bank accounts opened under the government’s Flagships financial inclusion drive ‘Pradhan Mantri Jan Dhan’ (PMJDY) - reached 44.63 crores and deposits in the Jan Dhan Bank accounts totaled ₹1.58 trillion.
-
In January 2022, the Unified Payments Interface (UPI) recorded 4.62 billion transactions worth ₹8.32 trillion.
-
The number of transactions through Immediate Payment Service (IMPS) reached 430.67 million and amounted to ₹3.70 million.
Concall Overview (Q4FY2022)
-
In FY 2022, the bank’s operating profit, i.e., NII plus fees minus OPEX, has risen by 44% Y-o-Y basis. Management expects this number to increase by another 45% in FY 2023.
-
The company has issued more than 1 million credit cards since it started this business in January 2021. The total credit card books account is ₹2,315 crores as of June 2022.
-
Concerning wholesale assets, the non-infra corporate loans grew by 12% on a Y-o-Y basis and 1% on a Q-o-Q basis to ₹23,900 crores. The infra book de-grew further and reduced by about 35% Y-o-Y basis and by 2% Q-o-Q basis to ₹6,739 crores and forms nearly 4.9% of the total funded assets as compared to 22% at the time of the merger.
-
The exposure to the top 20 single borrowers reduced from 16% in march 2019 to 9% in June 2022.
-
The CASA deposits of the bank have increased by 22% Y-o-Y basis to ₹56,730 crores.
-
The bank has successfully repaid cost legacy borrowing of ₹5,530 crores in the last 1-year, including 2.275 crores in the current quarter. The total outstanding of such high-cost borrowings stood at ₹22,406 crores on June 30, 2022.
-
The Gross and Net NPA of the bank improved to 3.36% and 1.3% as of June 30, 2022, as compared to 3.7% and 1.53% as of March 31, 2022. The provision coverage improved to 73.13% on June 30 compared to 70.29% on march 31, 2022, and 61.06% on June 30 last year.
-
Currently, the cost to income is 75%, which is expected to come down in the coming years.
IDFC FIRST Bank - Technical Analysis
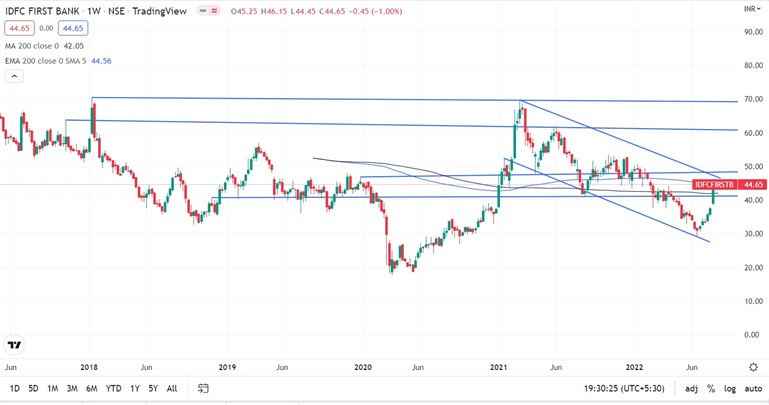
-
Stock is trading below EMA 200 and MA 200 indicators, with a support level of ₹40 and a resistance level of ₹48.
-
The stock can go into consolidation from here; one should wait for some technical reversal to invest.
Peers Comparison
|
|
FY-2022 |
|||
|
|
GNPA |
NPA |
ROA |
ROE |
|
AU Small Finance Limited |
2% |
0.50% |
1.63% |
15.03% |
|
Equitas Small Finance Bank Limited |
4% |
2.47% |
1.04% |
11.31% |
|
IDFC First Bank Limited |
4% |
1.53% |
0.06% |
1.82% |
Recommendation Rationale
-
The management plans to record steady growth in the retail and commercial loan book in the coming quarters by leveraging their expertise and tracking and targeting small entrepreneurs and retail customer segments to drive growth. The bank has more than 10 million retail customers as of March 2022.
-
The bank has gradually scaled down its infrastructure financing portfolio while the non-infrastructure corporate loans portfolio is set to grow on a selective basis. The wholesale funded assets are reduced by 46% since the merger and stood at ₹30,567 crores as of March 31, 2022. Within the wholesale funded assets, the legacy infrastructure financing portfolio, with identified potential risks, reduced to ₹6,739 crores as of June 30, 2022, from ₹10808 crores.
-
As the infrastructure financing portfolio, which was a major contributor to the bank’s GNPAs in the past, has already reduced sharply and retail loans have been growing at a steady pace, the structural change in portfolio composition is likely to support an improvement in the bank’s overall asset quality.
-
Capitalisation is healthy, as reflected in overall capital adequacy of 15.77% as on 30 June 2022. With incremental growth in the retail and commercial loans portfolio along with scaling down of the legacy infrastructure loan portfolio, capital consumption is expected to be lower than in the past. In addition, the management has demonstrated the ability to raise capital on several occasions in the past.
-
The bank has been putting its efforts toward developing a precise retail deposit franchise.
-
IDFC First Bank’s operating expenses are far higher than its peers, with the cost-to-income ratio at 73%. Further, the cost of funds is higher compared with other lenders despite low-cost current and savings account deposits in the total deposit base.
-
The goal of IDFC's reverse merger with IDFC First Bank is to increase value for the former's shareholders. As a result, the exercise provides the bank with minimal profit.
-
IDFC First Bank is associated with Key Managerial Risk, i.e., V Vaidhyanathan, MD & CEO, is the backbone of the bank and is a key person for managing operations of the banks at current levels. If anything goes wrong with the concerned person, this could put the bank at risk and could deteriorate the share value of shareholders.
-
Though the asset quality of the bank is improving, legacy accounts along with high-cost funding are a matter of concern.
-
Even though management has told in Q1FY2023 con-call regarding improving overall situation of the bank in coming quarters, the company’s performance in the coming quarters will be worth seeing.
Valuation
-
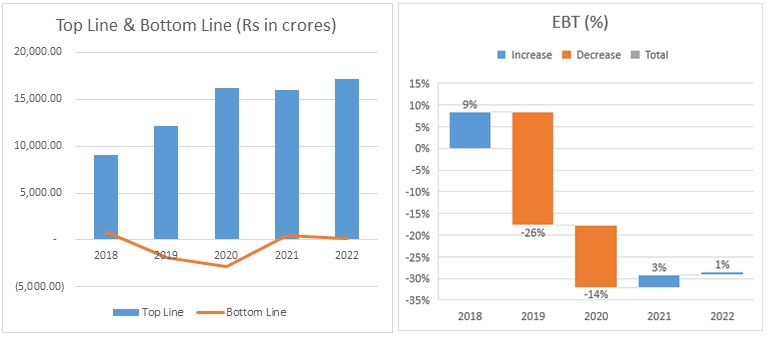
The Bank’s Net Interest Income has increased at a CAGR of 17% from FY 2018-2022
-
The Bank’s bottom line has deteriorated in FY 2019 & FY 2020 due to the provision created for legacy accounts.
-
IDFC First Bank’s ROA and ROE has also increased from 0.37% & 2.97% in Q2FY2022 to 0.97% & 8.96% in Q1FY2023.
-
We anticipate the company could generate higher Net Interest income for the following FY 2023, comparable to the prior year, based on the company's present performance in FY 2022.
-
Deposits have increased by 24% to ₹1,13,349 crores in Q1FY2023 compared to the previous year for the same period and Advances have increased by only 21% to ₹1,37,663 crores in Q1FY2023 compared to the previous year for the same period.
-
We used data from the last five years (2018-2022) to anticipate revenue for the fiscal years 2023–2027.
IDFC FIRST Bank - Estimated Income Statement (₹ in crores)
|
|
Mar-23 |
Mar-24 |
Mar-25 |
Mar-26 |
Mar-27 |
|
|
2023-E |
2024-E |
2025-E |
2026-E |
2027-E |
|
Interest income |
20,128 |
24,900 |
30,804 |
38,107 |
47,141 |
|
Interest Expended |
9,058 |
11,205 |
13,862 |
17,148 |
21,213 |
|
Net Interest Income |
11,071 |
13,695 |
16,942 |
20,959 |
25,928 |
|
|
|
|
|
|
|
|
Other income |
4,551 |
6,530 |
9,368 |
13,439 |
13,439 |
|
Total income |
15,622 |
20,225 |
26,310 |
34,398 |
39,367 |
|
|
|
|
|
|
|
|
Other expenses |
10,064 |
12,450 |
15,402 |
19,053 |
23,570 |
|
Provision and Contingencies |
4,412 |
5,956 |
7,743 |
9,678 |
11,614 |
|
PAT |
1,146 |
1,819 |
3,165 |
5,666 |
4,182 |
-
We initiate coverage on IDFC First Bank Limited with a “Buy” and a 1-year Target Price of ₹ 55.
Disclaimer: This report is only for the information of our customers Recommendations, opinions, or suggestions are given with the understanding that readers acting on this information assume all risks involved. The information provided herein is not to be construed as an offer to buy or sell securities of any kind.
- Share :


Post a Comment
|
DISCLAIMER |
This report is only for the information of our customers. Recommendations, opinions, or suggestions are given with the understanding that readers acting on this information assume all risks involved. The information provided herein is not to be construed as an offer to buy or sell securities of any kind. ATS and/or its group companies do not as assume any responsibility or liability resulting from the use of such information.