Hindustan Copper Ltd.
Hindustan Copper Ltd - Company Overview
Hindustan Copper Ltd. (HCL) is a Category Mini Ratna Central Public sector undertaking under the administrative control of the Ministry of Mines, Government of India having five decades of experience in mining of copper. The Company was incorporated on 09.11.1967 under the Companies Act, 1956. The President of India is holding 82.5% of the total paid up equity capital of Rs.462.69 crore and the remaining 17.5% is held by the Public. Major activities of Hindustan Copper Limited (HCL) are Exploration, Mining, Ore Beneficiation, Smelting, Refining and Casting of refined copper metal into downstream products. It is the only company in India engaged in mining of copper ore and owns all the operating mining lease of Copper are in the country. The company has access to over two-third of the India's copper are reserves and owns all the operating mining leases of copper are. The company has reserves of 411.53 Mn tonnes and resources of 623.31 Mn tonnes. Hindustan Copper Ltd (HCL) is also the only integrated producer of refined copper in the country. Hindustan Copper Ltd (HCL) has five units - one each in the States of Rajasthan, Jharkhand, Madhya Pradesh, Maharashtra and Gujarat.
|
Particulars (Rs. in Crs) |
FY12 |
FY13 |
FY14 |
FY15 |
FY16 |
|
Net Sales |
1641.44 |
1476.64 |
1625.05 |
1138.20 |
1074.22 |
|
Operating Profit |
618.52 |
560.10 |
607.11 |
194.44 |
168.82 |
|
PAT |
321.37 |
350.52 |
279.17 |
65.76 |
42.12 |
|
EPS (Rs.) |
3.47 |
3.79 |
3.02 |
0.71 |
0.46 |
|
PE (x) |
17.42 |
15.97 |
20.05 |
85.12 |
132.90 |
|
CMP (as on 06/12/2016) |
60.5 |
|
Stock Beta |
1.92 |
|
52 Week H/L |
73.60/42.30 |
|
Market Cap (Cr) |
5551.31 |
|
Equity Capital (Rs cr) |
462.61 |
|
Face Value (Rs) |
5 |
|
|
|
|
Shareholding Pattern (%) |
|
|
Promoters |
82.5 |
|
Non Institutions |
17.5 |
|
Grand Total |
100 |
Hindustan Copper Ltd - Investment Rationales:
-
Copper consumption to improve
-
Vertical integration will help reduction in cost and risk
-
Expanding capacity to drive volumes
-
Pick up in copper demand and price to drive margins
-
Positive global growth forecast
The revenues have come down ~35% from Rs.1641.44 crore in FY12 to Rs.1074.22 FY16 and the margins came down from 19.6% to 3.9% in the same period. This is mainly due to the closure of mines and not using the capacity of scale and the fall of the international copper prices. Hindustan Copper Ltd (HCL) is a dominant player in the Indian copper industry with more than two-third of the ores at its disposal. With the increase in copper mining capacities from approximately 3.21 MTPA to approximately 12.41 MTPA by the end of fiscal 2017, improvement in domestic consumption, rise in global copper prices, and restarting its full-scale production, we expect the company to outperform the industry in both medium-term and long term future.
Hindustan Copper Ltd - Industry Overview
Copper, historically known as “Dr Copper,” was traditionally used as a barometer to track the health of the global economy. The red metal was referred by this moniker because of its versatility in applications. Copper, the third-most abundantly produced metal, is extensively used in electronics, plumbing, wiring, heating, ventilation, etc. The meltdown in prices of metals is primarily on account of supply glut and muted demand from China. While copper prices are falling in a hurry, the global economy has stayed relatively put. Contrary to tradition, since the global financial crisis, the correlation between copper prices and global economic growth has got diluted.
World market scenario
Copper is the second-most-important base metal by value accounting for roughly a $150 billion industry annually and China consumes almost half of the world’s refined copper. Chile is the largest producer, followed by China and Peru. A few companies are involved in copper production, Chile’s Codelco is the largest among them. Copper prices have behaved more transparently than those of iron ore because of the fact that copper futures markets and London Metal Exchange settlements are used as benchmarks.
The worldwide demand for copper is expected to witness a 4.7% surge every year totting up to 37.2 million metric tonnes in 2019 and the global refined copper production is expected to rise at a rate of 4.6% per year reaching 29.1 million metric tonnes by 2019. As far as demand scenario is concerned, Asia-Pacific region will be experiencing the fastest annual gains, primarily led by increased output from India and China. The fall in copper prices that we saw from the end of 2013 to the beginning of 2016 was primarily due to a slowdown in demand from the largest consumer China. Due to the uncertainty surrounding China’s economic growth, the global copper market, at present is waiting for India’s demand to pick up. In order to meet the shortfall in demand due to slowdown in China, India’s copper demand need to grow at 6% or more annually. A recovery in the end-user industries like industrial construction, civic infrastructure, power, automobiles, industrial machinery, and consumer goods, among others are required to boost up the domestic copper demand.
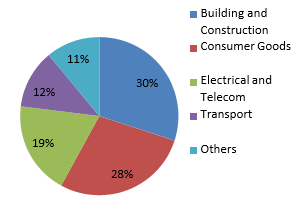
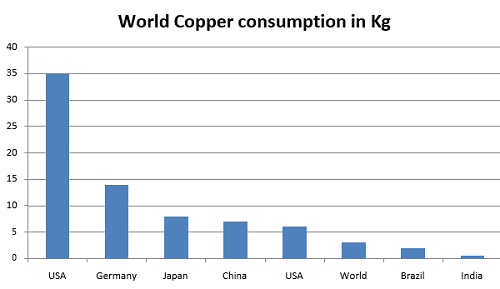
World copper usage breakup
Hindustan Copper Ltd - Indian markets
Copper is an 8 billion US dollar industry in India having created 50,000 direct and indirect jobs and growing at a CAGR 5-7% per annum. According to the ministry of mines, the size of India’s copper industry is estimated at around 500,000 tonne per year, which as percentage of the world copper market is only 3%. In India, the production of the metal is undertaken by state-run Hindustan Copper Ltd and private sector companies such as Hindalco Industries Ltd and Sterlite Industries (India) Ltd.
India imports about 94% of copper concentrate to be supplied to its smelters. India’s copper concentrates imports are so much so that there is a massive disparity noticed between the surplus in the country’s refining capacity and the deficit in its domestic mining capacity. With limited ore reserves and growing consumption of refined copper, there is enough reason to be worried. Another threat remains in the long term could be the restriction on – situation might arise in the future when obtaining copper concentrates from the international market would be restricted. This might create a serious problem for the domestic copper industry. Therefore, the domestic industry needs to increase the resources base of the red metal immediately by increased investment in exploration and in other countries for acquisition of mining assets. The MMDR Act by the Indian government will lead to an increased investment in mining and renewed focus on exploration and will also offer mining concession for exploration based on transparent auction. Further, this act will make licensing and permits more transparent and speedy. India’s metallic mineral production in FY’16 witnessed a 21% increase; amounting to 190.74 MT. Production of raw copper was up by 31% from the previous fiscal.
The biggest challenge faced by the domestic copper industry is its inadequate copper mining capacity. The country is amongst top ten exporters for refined copper. At the same time, the country is one of the world’s biggest importers of raw copper. India lacks extensive copper reserves and accounts for only 1.9 percent of the world’s copper reserve and resource. India’s total copper reserves are estimated to be around 712.5 MT, equivalent to 9.4 MT of metal content. Major ore deposits are located in the states of Jharkhand, Madhya Pradesh, and Rajasthan along with small deposits in Gujarat, Karnataka, Andhra Pradesh, Uttar Pradesh, Sikkim, Meghalaya, Maharashtra and West Bengal. Copper ore production accounts for less than an alarming 5% of the country’s demand. Against the global average of metal content (in the ore) of 2.5%, copper ore grade in India averages less than 1%. As per some analysts, at least 100 MT of copper ore is required for meeting installed smelting/refining capacity against annual production of 3 MT.
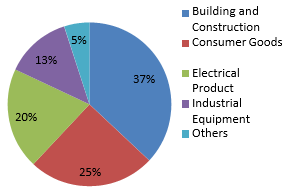
India copper usage breakup
Business Overview
|
Long-Standing Presence |
|
|
Vertically Integrated Operations |
|
|
Sole Copper Ore Producer in India |
|
|
Access to Substantial Reserves |
|
|
Clear Roadmap for Expansion |
|
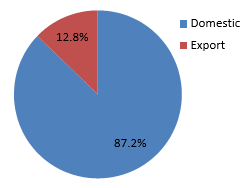
Revenue mix (FY16)
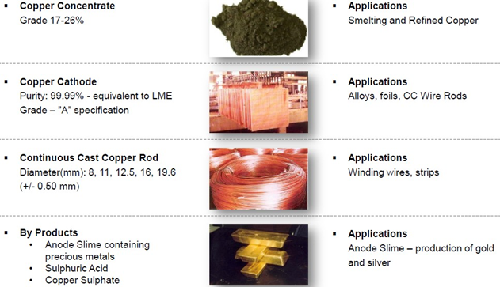
Products and applications
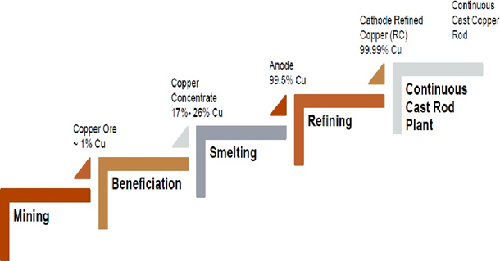
Copper manufacturing process
Hindustan Copper Ltd - Financials
Profit and Loss Account
|
|
FY12 |
FY13 |
FY14 |
FY15 |
FY16 |
|
INCOME : |
|
|
|
|
|
|
Sales Turnover |
1641.44 |
1476.64 |
1625.05 |
1138.2 |
1074.22 |
|
Excise Duty |
146.57 |
150.28 |
133.78 |
120.82 |
103.12 |
|
Net Sales |
1494.87 |
1326.36 |
1491.27 |
1017.38 |
971.1 |
|
Other Income |
84.92 |
250.44 |
102.84 |
66.9 |
48.77 |
|
Stock Adjustments |
-22.15 |
44.72 |
42.71 |
14.37 |
87.21 |
|
Total Income |
1557.64 |
1621.52 |
1636.82 |
1098.65 |
1107.08 |
|
EXPENDITURE : |
|
|
|
|
|
|
Raw Materials |
71.54 |
55.22 |
66.83 |
30.64 |
45.41 |
|
Power & Fuel Cost |
159.53 |
251.14 |
190.15 |
176.11 |
169.72 |
|
Employee Cost |
337.93 |
355.26 |
361.99 |
329.63 |
319.4 |
|
Other Manufacturing Expenses |
239.19 |
261.29 |
277.58 |
255.17 |
287.7 |
|
Selling and Administration Expenses |
109.12 |
123.18 |
115.2 |
93.23 |
104.21 |
|
Miscellaneous Expenses |
21.81 |
15.32 |
17.98 |
19.43 |
11.83 |
|
Less: Pre-operative Expenses Capitalised |
0 |
0 |
0 |
0 |
0 |
|
Total Expenditure |
939.12 |
1061.41 |
1029.72 |
904.2 |
938.26 |
|
Operating Profit |
618.52 |
560.1 |
607.11 |
194.44 |
168.82 |
|
Interest |
1.53 |
5.51 |
2.32 |
1.14 |
3.11 |
|
Gross Profit |
616.99 |
554.59 |
604.79 |
193.3 |
165.71 |
|
Depreciation |
144.06 |
150.98 |
174.14 |
112.85 |
120.33 |
|
Profit Before Tax |
472.93 |
403.61 |
430.65 |
80.45 |
45.38 |
|
Tax |
158.71 |
79.7 |
144.58 |
31.63 |
21.64 |
|
Fringe Benefit tax |
0 |
0 |
0 |
0 |
0 |
|
Deferred Tax |
-9.22 |
-31.73 |
-0.35 |
-18.78 |
-19.82 |
|
Reported Net Profit |
323.44 |
355.64 |
286.42 |
67.6 |
43.56 |
|
Extraordinary Items |
2.07 |
5.12 |
7.25 |
1.84 |
1.44 |
|
Adjusted Net Profit |
321.37 |
350.52 |
279.17 |
65.76 |
42.12 |
|
|
|
|
|
|
|
|
PBIDTM(%) |
37.7% |
37.9% |
37.4% |
17.1% |
15.7% |
|
PBDTM(%) |
37.6% |
37.6% |
37.2% |
17.0% |
15.4% |
|
PATM(%) |
19.6% |
23.7% |
17.2% |
5.8% |
3.9% |
The fall in sales from Rs.1138.2 crore in FY15 to Rs.1072.22 in FY16, which is mainly because of fall in copper prices in international market, in turn resulted in reduction in PAT margins from 5.8% to 3.9%. Other major factors affecting the profitability of Hindustan Copper Limited (HCL) is reduction in other income from Rs.66.9 crore to Rs.48.77 crore and the increase in other manufacturing expenses.
Balance Sheet
|
|
FY12 |
FY13 |
FY14 |
FY15 |
FY16 |
|
SOURCES OF FUNDS : |
|
|
|
|
|
|
Share Capital |
462.61 |
462.61 |
462.61 |
462.61 |
462.61 |
|
Reserves Total |
935.03 |
1189.48 |
1366.66 |
1398.92 |
1450.78 |
|
Equity Share Warrants |
0 |
0 |
0 |
0 |
0 |
|
Equity Application Money |
0 |
0 |
0 |
0 |
0 |
|
Total Shareholders Funds |
1397.64 |
1652.09 |
1829.27 |
1861.53 |
1913.39 |
|
Secured Loans |
0 |
0 |
0 |
0 |
207.15 |
|
Unsecured Loans |
0 |
0 |
0 |
0 |
0 |
|
Total Debt |
0 |
0 |
0 |
0 |
207.15 |
|
Other Liabilities |
84.79 |
75.23 |
56.06 |
99.64 |
111.65 |
|
Total Liabilities |
1482.43 |
1727.32 |
1885.33 |
1961.17 |
2232.19 |
|
APPLICATION OF FUNDS : |
|
|
|
|
|
|
Gross Block |
788.15 |
807.54 |
835.07 |
865.97 |
886.67 |
|
Less: Accumulated Depreciation |
578.97 |
601.21 |
623.27 |
663.96 |
686.7 |
|
Less: Impairment of Assets |
0 |
0 |
0 |
0 |
0 |
|
Net Block |
209.18 |
206.33 |
211.8 |
202.01 |
199.97 |
|
Lease Adjustment |
0 |
0 |
0 |
0 |
0 |
|
Capital Work in Progress |
479.63 |
587.13 |
690.71 |
851.34 |
1217.58 |
|
Producing Properties |
0 |
0 |
0 |
0 |
0 |
|
Investments |
148.63 |
88.58 |
29.4 |
71.08 |
75.81 |
|
Current Assets, Loans & Advances |
|
|
|
|
|
|
Inventories |
375.43 |
410.27 |
447.6 |
468.82 |
542.72 |
|
Sundry Debtors |
121.74 |
184.51 |
198.83 |
85.22 |
57.33 |
|
Cash and Bank |
449.21 |
438.45 |
495.67 |
251.77 |
240.31 |
|
Loans and Advances |
67.91 |
103 |
93.43 |
186.78 |
99.6 |
|
Total Current Assets |
1014.29 |
1136.22 |
1235.53 |
992.59 |
939.96 |
|
Less: Current Liabilities and Provisions |
|
|
|
|
|
|
Current Liabilities |
172.56 |
209.97 |
182.34 |
223.52 |
304.45 |
|
Provisions |
248.01 |
175.79 |
195.21 |
47.9 |
32.3 |
|
Total Current Liabilities |
420.57 |
385.76 |
377.54 |
271.43 |
336.75 |
|
Net Current Assets |
593.72 |
750.47 |
857.99 |
721.16 |
603.22 |
|
Miscellaneous Expenses not written off |
0 |
0 |
0 |
0 |
0 |
|
Deferred Tax Assets |
103.63 |
77.82 |
81.58 |
95.1 |
108.54 |
|
Deferred Tax Liability |
97.81 |
40.27 |
43.68 |
38.41 |
32.03 |
|
Net Deferred Tax |
5.82 |
37.55 |
37.9 |
56.69 |
76.51 |
|
Other Assets |
45.45 |
57.26 |
57.54 |
58.89 |
59.1 |
|
Total Assets |
1482.43 |
1727.32 |
1885.34 |
1961.17 |
2232.19 |
Key Ratios
|
FY12 |
FY13 |
FY14 |
FY15 |
FY16 |
|
|
Debt-Equity Ratio |
0 |
0 |
0 |
0 |
0.05 |
|
Current Ratio |
2.12 |
2.47 |
2.99 |
3.29 |
3.15 |
|
Fixed Assets |
2.11 |
1.85 |
1.98 |
1.34 |
1.23 |
|
Inventory |
4.35 |
3.76 |
3.79 |
2.48 |
2.12 |
|
Debtors |
17.56 |
9.64 |
8.48 |
8.01 |
15.07 |
|
Total Asset Turnover Ratio |
1.2 |
0.92 |
0.9 |
0.59 |
0.51 |
|
Interest Cover Ratio |
310.1 |
74.25 |
186.63 |
71.57 |
15.59 |
|
PBIDTM (%) |
37.68 |
37.93 |
37.36 |
17.08 |
15.72 |
|
PBITM (%) |
28.91 |
27.71 |
26.64 |
7.17 |
4.51 |
|
PBDTM (%) |
37.59 |
37.56 |
37.22 |
16.98 |
15.43 |
|
CPM (%) |
28.48 |
34.31 |
28.34 |
15.85 |
15.26 |
|
ROCE (%) |
34.62 |
25.49 |
23.97 |
4.24 |
2.31 |
|
RONW (%) |
25.08 |
23.32 |
16.45 |
3.66 |
2.31 |
|
Payout (%) |
30 |
27.22 |
34.18 |
21.43 |
0 |
|
PBIDT/Sales(%) |
37.68 |
37.93 |
37.36 |
17.08 |
15.72 |
|
Sales/Net Assets |
1.11 |
0.85 |
0.86 |
0.58 |
0.48 |
|
PBDIT/Net Assets |
0.42 |
0.32 |
0.32 |
0.1 |
0.08 |
|
PAT/PBIDT(%) |
52.29 |
63.5 |
47.18 |
34.77 |
25.8 |
|
Net Assets/Net Worth |
1.06 |
1.05 |
1.03 |
1.05 |
1.17 |
|
ROE(%) |
25.08 |
23.32 |
16.45 |
3.66 |
2.31 |
|
Price Earning (P/E) |
80.33 |
25.26 |
23.41 |
90.14 |
107.98 |
|
Price to Book Value ( P/BV) |
17.7 |
5.19 |
3.47 |
3.14 |
2.45 |
|
Price/Cash EPS (P/CEPS) |
54.7 |
17.47 |
14.27 |
32.87 |
28.65 |
|
EV/EBITDA |
39.29 |
14.53 |
9.64 |
28.73 |
27.62 |
|
Market Cap/Sales |
15.08 |
5.81 |
3.91 |
5.13 |
4.37 |
Investment Rationales
Copper consumption to improve
India’s copper consumption is projected to increase at an average annual rate of 8.4% to 802 kt by 2020 underpinned by rapidly increasing investment in electricity generation capacity and distribution networks. The Governmental focus on resolving the electricity supply shortages and raising heavy investments toward building the power generation capacity in order to ensure that all citizens have access to electricity, which will in turn, boost the demand for copper in the medium term. Rapid rates of industrialization and urbanization have created a need for expansion and investment in the country’s electrical and power infrastructure. According to the Twelfth Five Year Plan (2012–17), the Government is targeting a 43% increase in power generation capacity. Moreover, the Government has planned to set up five ultra mega power projects of 4,000MW each. This is expected to spur copper demand as the electrical and power sectors to account for nearly one-third of the refined copper consumption. Demand from other industries such as transport, consumer and electronic goods, and industrial machinery is also expected to remain strong on the back of increased end-user demand and increasing investments. For instance, the Government announced an investment of US$137 billion to upgrade India’s rail network over the next five years. Copper demand from the country’s transport industry is forecasted to rise to 900,000 tonnes a year by 2020. The Central government initiatives such as Housing For All, Smart Cities along RBI lowering the interest rates can further fuel copper demand. The country’s Rural Electrification Corporation endorses only copper usage for internal wiring in the form of an US$ 11 billion scheme known as the Deendayal Upadhyaya Gram Jyoti Yojana, or DDUGJY. The scheme entails a speedy provision of electrification to one crore households in about one lakh rural villages. Hindustan Copper Ltd (HCL) is expected to be a major beneficiary from an increase in copper consumption in the market.
Vertical integration will help reduction in cost and risk
The copper operations of Hindustan Copper Limited (HCL) span the entire value chain and consist of copper ore mining, copper ore concentration, copper refining, smelting, and extruding. Unlike other refined copper producers in India, it produces its own copper concentrate and does not need to rely on copper concentrate imported from abroad. Therefore, the copper refining business is generally not subject to the volatility of the international price of copper concentrate. Furthermore, since all of the mines and smelting and refining facilities are located in India, it has relatively low logistic costs involved in moving the copper concentrate to Indian refining facilities to produce refined copper. Being able to produce its own copper concentrate also provides HCL with certainty in its quality and available quantity. More importantly, with the mining of copper ore and production of its own copper concentrate, it has the flexibility to either use its copper concentrate to produce refined copper or sell the copper concentrate to other refined copper producers in India, depending on the profitability and other business considerations of either track. As a result, we believe that vertically integrated operations provide a great deal of flexibility to change the product mix and take advantage of market opportunities.
Pick up in copper demand and price to drive margins
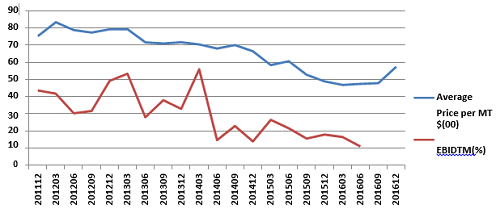
The average price of copper in LME for the last five years was ~6714.71 dollars per metric ton and the current price is around 5822 dollars per metric ton ie the current market price of copper is trading at more than 15% of its five-year median price. With the expected increase in demand of copper mainly from Asia which currently consumes 63% of the total usage of copper in the world and pick-up in demand from emerging economies can make a positive impact on global copper prices. Being a major copper player in the market HCL will be a major beneficiary of the increase in copper prices as it has a positive correlation with operating margins and copper prices.
Future Outlook
India's current per capita copper consumption is around 0.5 kg; but, it is expected to increase to 3 kg by 2025 mainly due to an increase in demand for a better lifestyle, defense, infra, power, and consumption. The Per capita electricity consumption in India is still very low, about 780kWh in comparison to the global average of 2780kWh, which is expected to improve over the period of time mainly driven by an increase in usage by the youthful population.
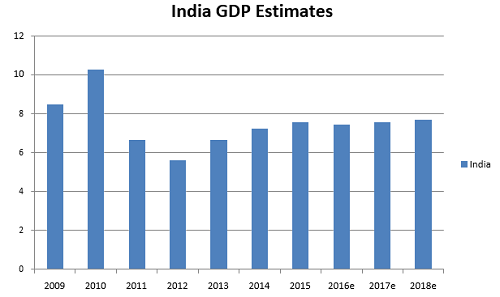
The copper industry is considered to be a major contributor to the infrastructure growth of the Indian economy. Therefore, with the expected steady growth of the country’s economy, there lies enough scope for the copper industry to grow in the coming years. Implementation of various structural and pro-business reforms will lead to the revival of domestic economic growth in a phased manner. With the domestic GDP projected to grow at a rate of 7% in the coming years, demand for Copper will also see a boost. The Make in India initiative launched by the Indian government could be another major demand driver, as due to this initiative, the domestic manufacturing segment is expected to see growth. The user industries like infrastructure, power, construction, and automobile will also be experiencing growth and a renewed drive which will result in the development of the country’s mining and metal industries in general, and Hindustan Copper Ltd (HCL) is expected to be a major beneficiary.
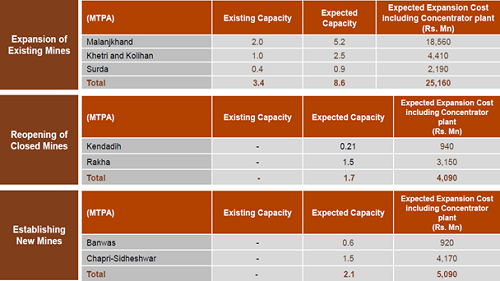
Expanding capacity to drive volumes
Hindustan Copper Limited (HCL) is in the process of expanding its mining capacities from approximately 3.21 MTPA to approximately 12.41 MTPA by the end of fiscal 2017. This expansion plan includes (i) expanding existing mines, namely the Malanjkhand mine of MCP, the Khetri mine and Kolihan mine of KCC as well as the Surda mine of ICC, (ii) reopening some of its mines that were closed in the past and renewing the mining leases, namely the Kendadih mine and Rakha mine of ICC and (iii) establishing new mines, namely the Ban was mine at KCC and the Chapri-Sideshwar mine at ICC. Upon completion of these expansion projects, the company expects that copper concentrate, rather than refined copper products, will be the primary product. It is expected to derive revenue primarily from the sale of copper concentrate. HCL is also gearing up to invest nearly Rs 100 crore to achieve full capacity at Jhagadia Copper Limited a company it acquired from Asset Reconstruction Company of India (ARCIL) for Rs 210 crore in Gujarat. The newly acquired unit, now renamed Gujarat Copper Project, has been revived and has started commercial production. HCL hopes to have installed copper cathode capacity of 50,000 tonnes next year. After the completion of expansion plans, we expect to benefit from increased economies of scale and improved efficiency, which will have a positive impact on the gross margins.
Positive global growth forecast
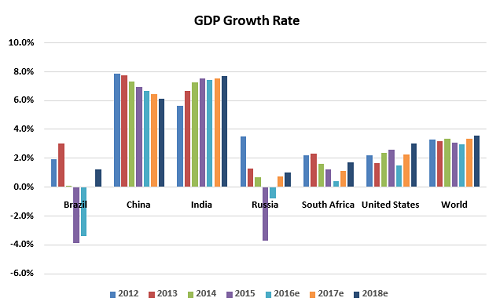
In advanced economies, a modest and uneven recovery is expected to continue, with a gradual further narrowing of output gaps. The picture for emerging market and developing economies is diverse but in many cases challenging. The slowdown and rebalancing of the Chinese economy, lower commodity prices, and strains in some large emerging market economies will continue to weigh on growth prospects in 2016–17. The projected pickup in growth in the next two years—despite the ongoing slowdown in China—primarily reflects forecasts of a gradual improvement of growth rates in countries currently in economic distress, notably Brazil, Russia, and some countries in the Middle East, though even this projected partial recovery could be frustrated by new economic or political shocks.
Overall urban population increases (by 2025, one billion people are projected to live in urban areas) and 221 Chinese cities will have over 1 million people (Europe has 35 cities with over 1 million people). Along with those massive increases, increased demand will be seen for buildings (5 million projected to be constructed by 2025) and transit (170 mass transit systems projected to be built- Europe has 70). Ultimately, whether it is more people, more buildings, or more infrastructure, more copper will be needed to facilitate construction.
Global growth is projected to slow to 3.6 percent in 2016 before recovering to 3.8 percent in 2017. The forecast, revised down by 0.2 percentage point for 2016 and 2017 relative to April, reflects a more subdued outlook for advanced economies following the June U.K. vote in favor of leaving the European Union (Brexit) and weaker-than-expected growth in the United States. These developments have put further downward pressure on global interest rates, as monetary policy is now expected to remain accommodative for longer. This is improving the prospects of global growth resulting in higher spending power benefiting the price and demand for copper.
Conclusion and Recommendation
HCL is a dominant player in the Indian copper industry with more than two third of the ores at its disposal. With no major incremental capex, increase in copper mining capacities from approximately 3.21 MTPA to approximately 12.41 MTPA by the end of fiscal 2017, improvement in domestic consumption, rise in global copper prices will help the company report strong improvement in financial performance. With the expected higher realizations and restarting its full scale production, we expect company to outperform the industry in the both medium term and long term future.
- Share :


Post a Comment
|
DISCLAIMER |
This report is only for the information of our customers. Recommendations, opinions, or suggestions are given with the understanding that readers acting on this information assume all risks involved. The information provided herein is not to be construed as an offer to buy or sell securities of any kind. ATS and/or its group companies do not as assume any responsibility or liability resulting from the use of such information.