HEIDELBERG CEMENT INDIA
|
Industry |
Market Price |
Recommendation |
Target |
Time Horizon |
|
Cement Industry |
158.95 |
BUY |
200 |
12 months |
Heidelberg Cement India Limited - Company Profile
Heidelberg Cement India Limited is a subsidiary of HeidelbergCement Group, Germany. The Company has its operations in Central India at Damoh (Madhya Pradesh), Jhansi (Uttar Pradesh) and in Southern India at Ammasandra (Karnataka). As of 2018, this company has 4 cement plants, 4 grinding plants and 1 cement terminals.
Heidelberg Cement India Limited - Investment Summary
|
CMP (Rs) |
158.95 |
|
52 Week H/L |
189.95/121.50 |
|
Market Cap (Cr) |
3,607.68 |
|
Face Value (Rs) |
10.00 |
|
Promoter Holding (%) |
69.39 |
|
Non-Promoter Holding (%) |
30.61 |
|
Total (%) |
100.00 |
-
Strong Operational Performance
-
Top 5th company in terms of production
-
Reduced its debts
-
Strong positioning in the central market
-
Main focus on cost control
Heidelberg Cement India Limited - Financial Summary
|
Particulars(Rs. Cr) |
Mar 18 |
Mar 17 |
Mar 16 |
Mar 15 |
Dec 13 |
|
Total Assets |
2,532.82 |
2,407.64 |
2,614.61 |
2,819.71 |
2,758.61 |
|
Total Revenue |
1,981.89 |
1,909.40 |
1,741.15 |
1,670.79 |
2,058.12 |
|
Profit after Tax |
133.18 |
133.18 |
76.21 |
35.39 |
59.53 |
|
EPS( Rs) |
5.88 |
5.88 |
3.36 |
1.56 |
2.63 |
Outlook and Valuation
HeidelbergCement India reported an increase of 50.48% in its net profit at Rs 50.08 crore for the September quarter, helped by volume growth. It has posted a net profit of Rs 33.28 crore in the July-Sept period a year ago. Total income during the quarter under review was at Rs 492.03 crore, up 14.90% as against Rs 428.22 crore in the corresponding period of the last fiscal. The company has repaid around 50 million in its 2nd quarter and remaining 750 million will repay in the rest of the year. Demand is mainly coming from housing projects in central India. Company is projecting 7% demand during the year. EBITDA clocked high EBITDA highest ever EBITDA per ton. In capacity utilization they are close to 82%. In terms of blended cements, they are a 100% blended cement company. Overall, the company has a strong positioning in the central market and has superior margin profit compared to its peer. Considering all the points we recommend “BUY” for this sock for long term.
Management Profile
|
Key Personnel |
Designation and Experience |
Auditors |
|
Mr. P.G. Mankad |
Chairman: Mr. P.G. Mankad, IAS (Retd.), aged 74 years, appointed as Chairman of the Board of Directors of the Company on 24th April 2008. He completed his M.A., done Diploma in Development Studies from Cambridge, U.K. He was Finance Secretary and Secretary in the respective Ministries of Government of India. Mr. Mankad has also worked as Executive Director with Asian Development Bank, Manila. Mr. Mankad has expertise in the areas of Public Administration & Policy, Finance, Industrial Development & Investment, International Economic Relations and Development Banking. |
S.N. Dhawan & Co. LLP. Chartered Accountants |
|
Dr. Albert Scheuer |
Non-executive Director: Dr. Albert Scheuer, aged 58 years, completed Degree in Mechanical Engineering from the Technical University of Clausthal, Germany in the year 1982. He done his degree as a Mechanical Engineer in 1982 and received his Doctorate in Mechanical Engineering in 1987. |
|
|
Mr. S. Krishna Kumar |
Independent Director: r. S. Krishna Kumar, aged 70 years appointed as the independent director of the company on 19h april 2007, former member of the Indian Administrative Service, holds a Masters degree in physics from Bangalore University and in Public Administration from the Harvard University. He has specialized in areas of public policy and in the governance in sectors like agriculture, public finance, infrastructure and migration. He is also the Chairman of Audit Committee and Corporate Social Responsibility Committee of the Board of Directors of the Company.
|
|
|
Mr. Pradeep V. Bhide |
Independent Director: Mr. Pradeep V. Bhide (aged 66 years) appointed as an independent director of the company on 29th April 2011. Mr. Pradeep is a retired IAS Officer and holds degrees in MBA, LL.B. and B.Sc. During his career spanning about four decades he held various positions at senior level. Mr. He is also the Chairman of Nomination and Remuneration Committee and a member of Audit Committee and Stakeholders' Relationship Committee of the Board of Directors of the Company. |
|
Heidelberg Cement India Limited - Company overview:
In 2006, HeidelbergCement Group entered India through a joint venture (JV) in Indorama Cement Limited and acquisition of the majority stake in Mysore Cement Ltd. HeidelbergCement Group acquired the balance stake of Indorama Cement in 2008 and merged the operations of the same with Mysore Cement Ltd and capacity of the Company increased to 3.07 million tonnes per annum. The merged entity was renamed as HeidelbergCement India Ltd on April 2009. The Company produce and markets cement under the brand name of mycem.
The company has one of the lowest Lost Time Injuries frequency rate of 0.13 against an industry average of 0.8 in the Country, almost 6 times lesser than the industry average and is testimony to the Safety Culture in the Company.
Heidelberg Cement India Limited - Products
PPC or Portland Pozzolana Cement is a kind of Blended Cement, produced by grinding the Portland clinker with gypsum and pozzolanic materials in measured proportions or by blending Ordinary Portland Cement, with Pozzolanic materials in certain proportions. Pozzolana, any natural or artificial material containing silica in a reactive form. The pozzolana is in a finely divided state to allowsilica to combine with calcium hydroxide in the presence of water forming stable Calcium Silicates Hydrate that has the cementitious properties. The pozzolanic materials commonly used are
-
Calcined clay
-
Fly ash
-
Silica fumes
PSC or Portland Slag cement is manufactured by either grinding the Portland clinker with gypsum and granulated slag or blending the ground granulated blast furnace slag with Ordinary Portland cement by means of mechanical blenders. Normal composition of portland cement is 30 percent clinker, 5 percent gypsum and 70 percent blast furnace granulated slag.
Key Ratios
|
Key Ratios |
FY18 |
FY17 |
FY16 |
FY15 |
FY14 |
|
Debt-Equity Ratio |
0.45 |
0.45 |
0.59 |
0.83 |
1.08 |
|
Current Ratio |
0.77 |
0.77 |
0.62 |
0.58 |
0.79 |
|
Inventory Turnover Ratio (x) |
14.89 |
15.46 |
12.30 |
9.25 |
10.70 |
|
Total Asset Turnover Ratio (%) |
74.59 |
77.46 |
71.33 |
63.04 |
72.49 |
|
PBDIT Margin (%) |
20.28 |
19.53 |
17.61 |
15.38 |
16.43 |
|
PBIT Margin (%) |
14.93 |
14.37 |
11.84 |
9.33 |
9.70 |
|
ROCE (%) |
16.84 |
7.94 |
12.28 |
2.15 |
3.15 |
|
RONW (%) |
12.72 |
12.72 |
7.88 |
3.95 |
6.92 |
|
Payout (%) |
34.02 |
0.00 |
0.00 |
0.00 |
0.00 |
|
Price/Book Value (x) |
3.08 |
3.08 |
2.92 |
2.05 |
1.97 |
|
EV/EBITDA (x) |
9.08 |
9.08 |
11.19 |
10.14 |
7.35 |
|
Market Cap/Sales |
1.71 |
1.64 |
1.65 |
1.11 |
0.83 |
Investment Rationale
-
Top 5th company in terms of production
Heidelberg Cement Company is one of the top 5 companies in terms of production. During FY18, the Company reported it’s highest ever production and sales volume, sales revenue and EBITDA. During the year ended 31st March 2018, the Company produced 4.61 million tonnes of cement compared to 4.44 million tonnes in the year ended March 2017, an increase of 3.7%. Cement sales for the year were 4.65 million tonnes compared to 4.47 million tonnes in FY17, an increase of 4.0%. Net sales in FY18 were INR 18,894.7 million compared to INR 17,174.6 million in FY17, an increase of 10.0%. The net profit for FY18 was INR 1,331.8 million compared to INR 762.1 million in FY17.
-
Strong positioning in the central market
This company has well-positioned its market in the central region. Most of its revenue has come from the central market. Heidelberg Cement India sells 94% of total cement volumes in the central region, a favorable region in India, considering the demand-supply scenario. The company sells the rest of the volume in the western and southern regions. Its share in the central region had gone up from 75% to over 94% led by capacity expansion in CY13.
-
Focus on quality, customer satisfaction and continuous improvement
This company is part of a global player in the field of the cement industry. Its main objective is to maintain the excellent quality of its products and the continuous delivery of customer satisfaction. They have improved their quality of products by using state-of-the-art technology. The company’s aim is to manufacture products that excel on durability factors at the same time add value for our customers. By transfer of knowledge, optimization of performance, and by implementing best practices throughout the group, new technologies are implemented speedily that finally result in improved products that ultimately benefit our customers.
-
Large global promoter
Heidelberg Cement India Ltd have the support of the rich experience of the German promoter Heidelberg AG, based in Germany, one of the world’s largest cement manufacturers with revenue of over €4.5 billion in Q3 2018. This support will help Heidelberg cement India Company to grow faster.
Industry Overview
India is the world's second-largest cement market and has added 110 million tonnes of cement by way of capacity in the last five years. India's cement capacity stood at 460MTPA as of December FY 2017 and is expected to increase by 5.0-5.5% y-o-y in FY 2018. India has 575 operational cement plants in the country and this industry is largely dominated by private players (98%). The top 20 cement companies manufacture around 70% of the total cement and a larger share of bigger plants are situated across southern and western parts of India across the states of Rajasthan, Andhra Pradesh, and Tamil Nadu.
The cement industry is dependent on natural resources and is highly energy intensive. Natural resources like limestone, coal and minerals are essential to produce cement. The industry needs to ensure the continuous supply of these materials at an optimum cost and quality, however due to the depletion of reserves, this is becoming challenging. Volatility in the price of coal is also an area of concern for the industry. The quality of raw material additive and mineral gypsum is also depleting. The MMDRA Act’s new notification as of 12 January 2015, stated that the renewal of Mining Leases and grants of Mining Leases and Composite Licenses will happen through Auctions. For continuous operation, there is a need to secure limestone with a minimum reserve of 50 years.
The ready-mixed concrete industry (RMC) has been considerably successful globally. RMC in India is still at a nascent stage. RMC accounts for only about 10-12% of the total concrete production in India, which is a small number as compared to western countries, where it comprises 50-70% of the total concrete consumption volume. The penetration level in the metropolitan and tier-I cities is relatively higher and accounts for about 35-40%, while in tier-II cities penetration level is about 20%. Over the past year, there has been a rise in demand for RMC due to technological improvements and innovations. The central government is pushing for more infrastructure development as well as completing on-going projects in a time bound plan. Government is also focusing on the creation of “smart cities” which would lead to the construction of commercial, residential and recreational centres, along with public utilities like roads and railways. This will boost the prospects for RMC as a viable alternative to traditional concrete.
RMC is also finding better acceptance among the most real estate developers in the country, especially in urban areas. Thus, the potential for this segment remains quite large.
For the above reason, manufacturers have stepped up efforts to improve capacities in this sector. Increase in demand for RMC is expected to boost cement production as well, as cement is the most essential component of RMC. RMC is expected to account for up to 25% of the total cement consumed by 2022, as predicted by Cement Vision 2025.
In India, there are 71 companies that operate integrated cement production facilities and 36companies that operate grinding plants, 6 of which do not have integrated ca[acity.The top 10 cement producers in india are shown in the below table.
|
Rank |
Company |
Integrated (Mt/yr) |
Grinding (Mt/yr) |
Total (Mt/yr) |
|
1 |
UltraTech Cement |
59.2 |
25.1 |
84.3 |
|
2 |
LafargeHolcim |
41.4 |
23.6 |
65.0 |
|
3 |
Dalmia Bharat |
17.4 |
6.5 |
23.9 |
|
4 |
Shree Cements |
8.0 |
12.2 |
20.2 |
|
5 |
HeidelbergCement |
12.1 |
7.5 |
19.6 |
|
6 |
Ramco Cement |
13.0 |
4.1 |
17.1 |
|
7 |
Chettinad Cement |
14.8 |
2.0 |
16.8 |
|
8 |
The India cements |
13.0 |
3.7 |
16.7 |
|
9 |
JK Cement |
7.9 |
4.2 |
12.1 |
|
10 |
Vicat |
11.8 |
0.0 |
11.8 |
|
Top 10 Total |
198.6 |
88.9 |
287.5 |
|
|
Indian Total |
328.6 |
117.4 |
446.0 |
|
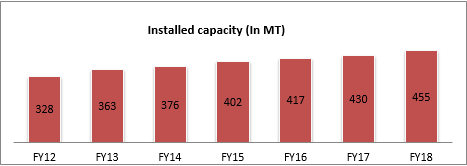
With nearly 455 million tonnes of cement production capacity, India is the second largest cement producer in the world. The cement production capacity by the time of 2020 is estimated to touch 550 MT. all India installed capacity was around 480 MT, in September 2018. Of the total capacity, 98 percent lies with the private sector and the rest with the public sector. The cement demand is expected to grow by 7-8 percent in FY19.
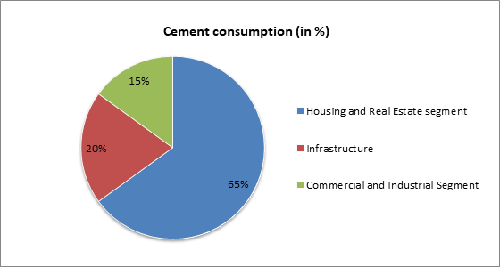
The housing and real estate sector is the biggest demand driver of cement, accounting for about 65% of the total consumption in India. The other major consumers of cement include public infrastructure at 20% and industrial development at 15%.
Peer Review
|
Name |
Last Price |
Market Cap. |
Sales Turnover |
Net Profit |
Total Assets |
|
UltraTechCement |
4,050.00 |
111,227.48 |
29,790.10 |
2,231.28 |
42,489.21 |
|
Shree Cements |
17,400.00 |
60,616.77 |
9,833.10 |
1,384.18 |
12,290.82 |
|
Ambuja Cements |
223.70 |
44,418.88 |
10,446.85 |
1,249.57 |
19,997.33 |
|
ACC |
1,526.40 |
28,663.85 |
13,284.60 |
915.45 |
9,424.63 |
|
Dalmia Bharat |
2,372.90 |
21,155.19 |
232.53 |
89.69 |
1,475.45 |
|
Ramco Cements |
648.60 |
15,279.51 |
4,406.36 |
555.66 |
5,041.13 |
|
Heidelberg Cem |
157.75 |
3,574.82 |
1,961.96 |
133.18 |
1,515.63 |
|
JK Lakshmi Cem |
282.00 |
3,318.30 |
3,412.15 |
83.96 |
3,264.59 |
|
India Cements |
96.10 |
2,975.85 |
5,340.72 |
100.62 |
8,173.19 |
Profit and Loss
|
Particulars (Rs. Cr) |
Mar 18 |
Mar 17 |
Mar 16 |
Mar 15 |
Mar 14 |
|
INCOME |
|
||||
|
Revenue From Operations [Gross] |
1,933.16 |
1,933.16 |
1,972.00 |
1,895.70 |
2,338.30 |
|
Less: Excise/Sevice Tax/Other Levies |
72.49 |
0.00 |
284.39 |
267.57 |
327.10 |
|
Revenue From Operations [Net] |
1,860.67 |
1,933.16 |
1,687.61 |
1,628.13 |
2,011.20 |
|
Other Operating Revenues |
28.80 |
28.80 |
29.85 |
20.22 |
33.08 |
|
Total Operating Revenues |
1,889.47 |
1,961.96 |
1,717.46 |
1,648.35 |
2,044.28 |
|
Other Income |
19.93 |
19.93 |
23.69 |
22.44 |
13.84 |
|
Total Revenue |
1,909.40 |
1,981.89 |
1,741.15 |
1,670.79 |
2,058.12 |
|
EXPENSES |
|
||||
|
Cost Of Materials Consumed |
356.64 |
356.64 |
325.99 |
342.78 |
443.83 |
|
Changes In Inventories Of FG,WIP And Stock-In Trade |
13.61 |
13.61 |
34.66 |
-9.34 |
-27.72 |
|
Employee Benefit Expenses |
120.15 |
120.15 |
114.76 |
105.02 |
133.73 |
|
Finance Costs |
74.45 |
74.45 |
89.77 |
108.45 |
138.93 |
|
Depreciation And Amortisation Expenses |
101.17 |
101.17 |
99.15 |
99.78 |
137.54 |
|
Other Expenses |
1,035.71 |
1,108.20 |
963.19 |
978.72 |
1,172.29 |
|
Total Expenses |
1,701.73 |
1,774.22 |
1,627.52 |
1,625.41 |
1,998.60 |
|
Profit/Loss Before Exceptional, ExtraOrdinary Items And Tax |
207.67 |
207.67 |
113.63 |
45.38 |
59.52 |
|
Exceptional Items |
0.00 |
0.00 |
0.00 |
0.00 |
60.31 |
|
Profit/Loss Before Tax |
207.67 |
207.67 |
113.63 |
45.38 |
119.83 |
|
Current Tax |
44.43 |
74.49 |
23.95 |
10.75 |
9.13 |
|
Deferred Tax |
30.06 |
0.00 |
13.27 |
-1.26 |
60.26 |
|
Total Tax Expenses |
74.49 |
74.49 |
37.42 |
9.99 |
60.26 |
|
Profit/Loss After Tax And Before ExtraOrdinary Items |
133.18 |
133.18 |
76.21 |
35.39 |
59.57 |
|
Profit/LossFromContinuing operations |
133.18 |
133.18 |
76.21 |
35.39 |
59.57 |
|
Profit/Loss For The Period |
133.18 |
133.18 |
76.21 |
35.39 |
59.53 |
|
EARNINGS PER SHARE |
|
||||
|
Basic EPS (Rs.) |
5.88 |
5.88 |
3.36 |
1.56 |
2.63 |
|
Diluted EPS (Rs.) |
5.88 |
5.88 |
3.36 |
1.56 |
2.63 |
Balance Sheet
|
Particulars (Rs. Cr) |
Mar 18 |
Mar 17 |
Mar 16 |
Mar 15 |
Mar 14 |
|
Equity Share Capital |
226.62 |
226.62 |
226.62 |
226.62 |
226.62 |
|
Total Share Capital |
226.62 |
226.62 |
226.62 |
226.62 |
226.62 |
|
Revaluation Reserves |
0.00 |
0.00 |
0.00 |
12.31 |
13.34 |
|
Reserves and Surplus |
819.78 |
740.33 |
668.31 |
632.63 |
593.40 |
|
Total Reserves and Surplus |
819.78 |
740.33 |
668.31 |
644.94 |
606.74 |
|
Total Shareholders Funds |
1,046.40 |
966.95 |
894.93 |
871.56 |
833.36 |
|
NON-CURRENT LIABILITIES |
|
||||
|
Long Term Borrowings |
469.23 |
575.19 |
670.86 |
924.89 |
1,292.62 |
|
Deferred Tax Liabilities [Net] |
83.50 |
53.00 |
41.94 |
65.22 |
4.96 |
|
Total Non-Current Liabilities |
628.89 |
688.91 |
747.46 |
1,013.80 |
1,317.35 |
|
CURRENT LIABILITIES |
|
||||
|
hort Term Borrowings |
0.00 |
0.00 |
70.00 |
0.00 |
64.20 |
|
Trade Payables |
226.63 |
191.41 |
185.96 |
190.99 |
190.11 |
|
Other Current Liabilities |
412.04 |
344.26 |
509.02 |
552.52 |
202.25 |
|
Short Term Provisions |
218.86 |
216.11 |
207.24 |
190.84 |
151.34 |
|
Total Current Liabilities |
857.53 |
751.78 |
972.22 |
934.35 |
607.90 |
|
Total Capital And Liabilities |
2,532.82 |
2,407.64 |
2,614.61 |
2,819.71 |
2,758.61 |
|
ASSETS |
|
||||
|
NON-CURRENT ASSETS |
|
||||
|
Tangible Assets |
1,804.38 |
1,874.42 |
1,897.50 |
1,788.81 |
1,786.16 |
|
Capital Work-In-Progress |
8.07 |
6.29 |
56.05 |
127.42 |
166.98 |
|
Fixed Assets |
1,814.10 |
1,883.36 |
1,957.24 |
1,921.19 |
1,954.30 |
|
Long Term Loans And Advances |
0.00 |
0.00 |
0.00 |
54.67 |
30.15 |
|
Total Non-Current Assets |
1,872.00 |
1,941.76 |
2,052.89 |
2,079.23 |
2,183.88 |
|
CURRENT ASSETS |
|
||||
|
Inventories |
126.89 |
139.64 |
178.21 |
191.00 |
198.92 |
|
Trade Receivables |
18.80 |
12.56 |
25.76 |
19.14 |
30.60 |
|
Cash And Cash Equivalents |
212.41 |
14.20 |
7.77 |
146.26 |
114.14 |
|
Short Term Loans And Advances |
0.00 |
0.00 |
0.00 |
296.69 |
230.62 |
|
OtherCurrentAssets |
302.72 |
299.48 |
349.98 |
87.39 |
0.45 |
|
Total Current Assets |
660.82 |
465.88 |
561.72 |
740.48 |
574.73 |
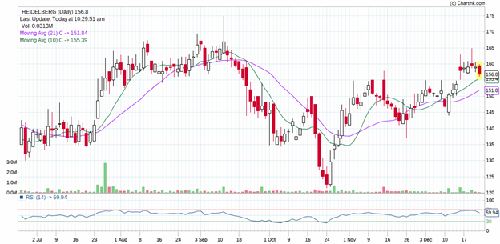
Stock Performance Chart
- Share :


Post a Comment
|
DISCLAIMER |
This report is only for the information of our customers. Recommendations, opinions, or suggestions are given with the understanding that readers acting on this information assume all risks involved. The information provided herein is not to be construed as an offer to buy or sell securities of any kind. ATS and/or its group companies do not as assume any responsibility or liability resulting from the use of such information.