HCL Technologies
HCL Technologies Limited is a global IT services company, headquartered in Noida, Uttar Pradesh, India. Originally the research and development division of HCL Limited, it emerged as an independent company in 1991 when HCL Limited ventured into the software services business. HCL Technologies offers services including IT consulting, enterprise transformation, remote infrastructure management, engineering and R&D and business process outsourcing (BPO).
|
Key Parameters |
|
|
BSE Code |
532281 |
|
NSE Code |
HCLTECH |
|
Reuters Code |
HCLT.NS |
|
INCEPTION |
NOVEMBER 1991 |
|
IPO |
1999 |
|
CMP (as on 23/09/2015) |
915 |
|
Stock Beta |
0.557 |
|
52 Week H/L |
707.50 / 1058.45 |
|
Market Cap (Cr) |
1,30,850 |
|
Equity Capital (Rs cr) |
140 |
|
Face Value (Rs) |
2.00 |
|
Average Volume |
13,82,590 |
|
|
|
|
Shareholding Pattern (%) |
|
|
Promoters |
60.58 |
|
Non Institutions |
39.42 |
|
Grand Total |
100.00 |
HCL Technologies Limited - Potential Catalysts
-
Growth from IMS and Engineering Services
-
Increasing client base
-
Entering next generation technologies
-
Efficiency and Higher service level due to streamlined process
HCL Technologies Limited - Recommendation
With Superior project management skills, focus on measuring and monitoring quality and its planned expansion HCL Technologies will be able to grow over the next few years. We recommend BUY on the stock at CMP of Rs. 915 to target of Rs. 1090 (Forward PE of 15.37x FY16).
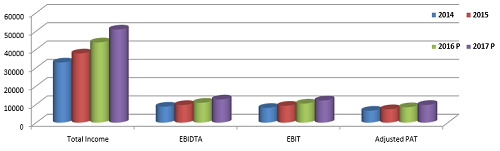
HCL Technologies Limited - Financial Summary
|
Yearly Financial Statement |
2014 |
2015 |
2016 P |
2017 P |
|
Total Income |
32821.06 |
37767.21 |
43805.54 |
50842.17 |
|
EBIDTA |
8712.69 |
9612.04 |
10868.88 |
12647.03 |
|
EBIT |
8031.83 |
9208.29 |
10412.34 |
12115.80 |
|
Adjusted PAT |
6509.51 |
7317.07 |
8402.03 |
9664.60 |
|
EPS |
93.18 |
52.09 |
59.59 |
68.54 |
|
EBIDTA Margin |
27.11% |
26.19% |
25.25% |
25.07% |
|
EBIT Margin |
24.99% |
25.09% |
24.38% |
23.95% |
|
PAT Margin |
19.83% |
19.37% |
19.18% |
19.01% |
HCL Technologies Limited - BUSINESS DISCRIPTION
HCL Technologies Limited (HCL) is a global technology company. The Company mainly operates in three segments: Software services, Information Technology (IT) Infrastructure services and Business Process Outsourcing services. Its services line includes, Business Services, Custom Application Services, Engineering and Research and Development (R&D) Services, Enterprise Application Services, Enterprise Transformation Services, IT Infrastructure Management Services and Outsourcing. It delivers solutions across a range of verticals, such as automotive, banking, chemical, energy (oil and gas) and utility, consumer electronics, financial services, consumer product goods, hi-tech, independent software vendor (ISV), insurance, life sciences, healthcare and pharmaceuticals, manufacturing, media, publishing and entertainment, retail, telecom, travel and tourism and logistics.
It operates across a number of industry verticals including aerospace and defense, automotive, consumer electronics, energy and utilities, financial services, government, independent software vendors, industrial manufacturing, life sciences and healthcare, media and entertainment, mining and natural resources, oil and gas, public services, retail and consumer, semiconductor, server and storage, telecom, and travel, transportation, logistics and hospitality.
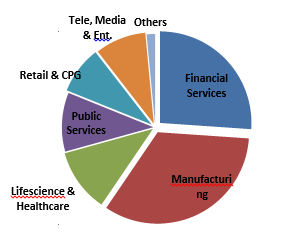
Revenue Distribution
|
In % |
Mar-15 |
Dec-15 |
Mar-15 |
|
Financial Services |
26.9 |
26.6 |
26.1 |
|
Manufacturing |
33.3 |
32.9 |
33.4 |
|
Life science & Healthcare |
10.4 |
11.1 |
11.2 |
|
Public Services |
10.1 |
9.5 |
10.4 |
|
Retail & CPG |
8.5 |
9.7 |
8.4 |
|
Telecommunications, Media & Entertainment |
8.4 |
8.4 |
9 |
|
Others |
2.3 |
1.8 |
1.5 |
MANAGEMENT & GOVERNANCE
|
Anant Gupta |
President and Chief Executive Officer |
|
Anil Kumar Chanana |
Chief Financial Officer |
|
Manoj Kumbhat |
Senior Vice President & Chief Information Officer |
|
Shiva Nadar |
Chairman and Chief Strategy Officer |
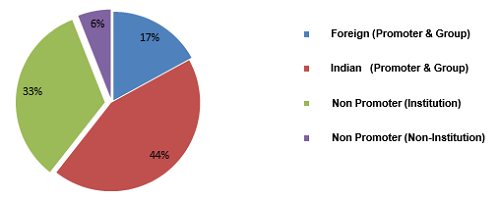
Shareholding pattern as on 30thJune, 2015
|
Category |
No. of Shares |
Percentage % |
|
Foreign (Promoter & Group) |
239097816 |
17.01 |
|
Indian (Promoter & Group) |
612623012 |
43.57 |
|
Non Promoter (Institution) |
470328259 |
33.45 |
|
Non Promoter (Non-Institution) |
83929331 |
5.97 |
|
Top Fund Holders (August) |
Market Value |
% Change MoM |
No of Shares |
|
ICICI Prudential Mutual Fund |
1382.4516 |
7.55 |
14236667 |
|
Reliance Mutual Fund |
1133.4253 |
-1.08 |
11672162 |
|
Birla Sun Life Mutual Fund |
623.3506 |
15.98 |
6419348 |
|
Franklin Templeton Mutual Fund |
394.4590 |
-1.71 |
4062190 |
|
SBI Mutual Fund |
324.3472 |
-4.67 |
3338333 |
Top funds like ICICI Prudential, Birla Sun Life, BNP Paribas, IDFC, LIC, J P Morgan have increased their stake in HCL Technologies Ltd over years which indicate positive demand for the stock.
INDUSTRY OUTLOOK
Enterprise software is in the midst of a revolution. Today, everyone's a power user. 2014 was all about the “consumerization” of enterprise software -- software companies redefining the user experience to make technology more closely resemble consumer applications. This will continue in this year as developers move away from a purely utilitarian approach to creating software that’s more intuitive, more user-friendly and able to cater to users’ changing needs.
TRENDS IN DEMAND ENVIRONMENT Enterprise Software
-
Gartner estimate the $310bn spend in 2015 growing to $396bn in 2019
-
IT Services – Applications Services (Implementation) worth $158bn in 2015, growing to $177bn in 2019
-
Digitalization – $170bn market growth from 2014-2019. $36bn in digital consulting and implementation, $13bn in digital consulting
-
Increased investment – CEOs intend to raise investment in IT and Digital Capabilities more than any other aspect of their business in 2015.
Increase in global technology spending and opportunities created through adoption of disruptive technologies are expected to propel growth in FY2015. NASSCOM expects the industry to clock export revenues of USD 84-87 billion maintaining a growth rate of 12-14 per cent. Domestic revenues will also grow at a rate of 13-15 per cent and are expected to reach INR 1180-1200 bn.
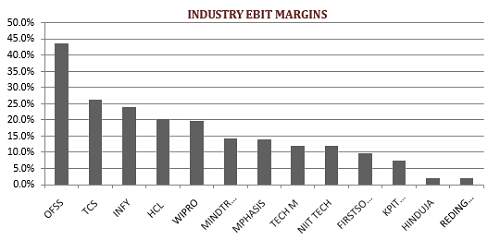
INDUSTRY EBIT MARGINS
INVESTMENT RATIONALE
One of the largest players in IMS and Engineering Services
Engineering spending is growing rapidly and holds promise. HCL Technologies has offerings in the engineering segment and has ability to execute. Companies spend around $1 trillion a year on engineering services and R&D and $19 billion is being outsourced. HCL Technologies Ltd is the fifth largest engineering service company. It has created service offering in engineering service space.
Most of the clients are blue chip manufacturing companies and semiconductor companies. Presently, 17- 18% revenue is coming from this vertical.
Under Infrastructure Management Services (IMS) HCL Technologies offer some of the core offerings like Enterprise Application Services, Enterprise Transformation Services, Custom applications, Engineering & R&D, Operations Transformation Outsourcing Services (OTOS), Telecom Expenses Management, Strategic Cost & Performance Management, and Managed Print Services.
HCL Technologies Ltd marginally lags behind TCS to occupy second position in infrastructure services with annualized revenue of $2 Billion against $2.2 Billion for TCS. Recent deal wins in Engineering Services manifest trend of Full Services Outsourcing within the segment, and pipeline of such deals are very healthy in the market.
We expect infrastructure management services (IMS) and engineering services to keep driving growth of the company.
Sustained mix of new and existing clients contributed to apps growth. A number of large deals were signed globally, led by SAP.
Company has added $5 billion deals in this year. It added one new client in the $100 million category in the fiscal, two in the $50 million plus three in the $30 million plus and added 47 clients in the million dollar plus category with client retention rates are 98%.
Revenue in Americas grew by 14.1% and Europe by 18.7%
Infrastructure revenue exceeded $2 billion which is growing significantly over previous year at 18.3.
Engineering Services added a billion and Financial Services by $1.5 billion. Engineering and R&D division grew at 25.8%. BPO services grew by 25.6%. Application grew a good growth of 7.7% both in Enterprise SI and IS showing good traction in the marketplace.
Also company has secured five-year IT managed services contract with risk management solutions providers SAI Global, which runs pretty much across the board in line with the mix of different service lines and geographies of the company.
Table shows the growth rate of various segments on vertical stand point of view (YoY growth),
|
Growth Vertical stand point |
|
|
Retail and CPG or Consumer Products |
24.70% |
|
Public Services which include Energy, Oil, Utilities and Logistics |
18.10% |
|
Financial Services |
16.60% |
|
Telecom, Media, Publishing |
15.50% |
|
Life Sciences |
16.30% |
|
Manufacturing |
13.90% |
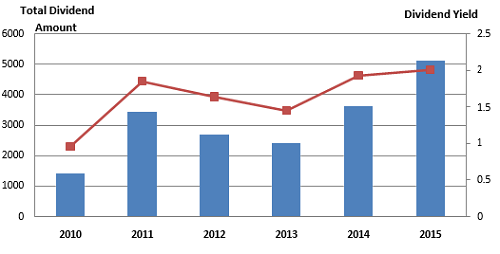
Consistent Dividend History
One of the advantages to shareholders in the respect of stock dividends is the tax benefit. The receipt of the stock dividends by the shareholder is not taxable as income. The payment of stock dividend is normally interpreted by shareholders as an indication of higher profitability.
In the present unpredictable market conditions, picking stocks with high dividend yields is a good strategy for those who are here to invest with a long-term goal as such stocks gives investors fairly regular dividends, plus the capital appreciation could also be fairly good.
|
YearEnd |
Total DividendAmount Distributed |
Div. Yield-% |
|
2011 |
3445 |
1.85 |
|
2012 |
2699 |
1.64 |
|
2013 |
2412 |
1.45 |
|
2014 |
3618 |
1.93 |
|
2015 |
5111 |
2.01 |
Investment in disruptive technologies as the impact of digital transformation becomes more prevalent
Continued demand for modernization of legacy systems is shifting customers IT landscapes as they seek to compete. We believe this is a valuable opportunity for HCL Technologies to provide support to customers on this journey.
Gen 2.0 strategy
-
Is Next Gen Infrastructure proposition DSI which is Digital Systems Integration offering the transformational capabilities around Application Services,
-
ALT ASM™ new way of delivering Application Management Services, and at the process level the enterprise function as a service ZCMO strategy and then the R&D by Innovation Monetization
HCL’s Digital Systems Integration offering enables customers to leverage new technology and continues a trend toward digital and cloud offerings, particularly in SAP S/4, SAP hybrids, Application Modernization and Microsoft CRM.
It has announced the launch of a United Xperience Lab Offering to institutionalize co-innovation process for building Digital solutions for and with its customers.
The United Xperience Offering works on the premise of co-innovation with customers. The Offering is a multi-layered framework wherein human intelligence and psychometrics, interface with nextgen technology to create intuitive and smart Digital solutions which harmoniously embed themselves into user value chains and deliver “United Xperience” to customers.
For the purpose HCL Technologies announces global partnership with Manchester United, which is also club’s first official digital transformation partner.
HCL Technologies Ltd will create a state-of-the-art United Xperience Lab to be housed within the iconic Old Trafford stadium, which will make it the seventh such lab across the world. Within the lab, HCL and Manchester United will explore revolutionary ways in which the club uses technology to create a unified fan experience for supporters; and in the process set a new engagement benchmark in the world of sport.
VALUATION
HCL Technologies is currently trading at 915 per share with a market capitalization of 1.3 Lakh Crores. It has total debt of 825.21Cr with long term Debt to Equity of 0.04. It has total cash and bank balance of 7911.08 Cr. Its payout increased to 37% (FY15) from 28% last year (FY14).
|
Price |
Market Cap |
Cash |
Debt |
|
912.5 |
1,30,180 Cr |
9786.23 |
825.21 |
We value HCL Technologies using DCF at price target of 1090 for FY16 with expected growth rate at 16.54% per annum. For valuation we assume that over the period company will keep capital structure unaltered and tax rate unchanged.
|
|
Industry average |
HCL Tech |
|
OPM % |
30.98 |
25.45% |
|
NPM % |
20.92 |
19.37% |
|
EPS |
60.11 |
52.09 |
|
PE |
20.87 |
17.48 |
|
P/BV |
6.23 |
5.76 |
|
BV |
277.66 |
160.66 |
CONCUSSION AND RECOMMENDATION
With Superior project management skills, focus on measuring and monitoring quality and its planned expansion HCL Technologies will be able to grow over the next few years. We recommend BUY on the stock at CMP of Rs. 915 to target of Rs. 1090 (Forward PE of 15.37x FY16).
RISKS AND CONCERNS
-
The current trend of weakness in the rupee will contribute to the profitability of export oriented companies.
On the flip side, if the rupee depreciated beyond 65-66 against the dollar, HCL Technologies Ltd may end up reporting realized foreign exchange (Forex) losses since it has sold a portion of its future dollar revenue at 64-65 levels in forward currency markets. It has a hedge position of $1.4 billion at an average rupee rate of 65 against the dollar. Therefore, a rupee rate above this threshold will cause a Forex loss as and when the company realizes revenue.
-
HCL Technologies deals in the world-wide market. The different market dynamics have a slight bearing on the operations of the company. The Gains of HCL Technologies is significantly inter-linked with the growth of the Banking Industry all over the Globe.
-
The rapidly developing markets and the Competition in the market is a major concern for HCL Technologies Ltd
FINANCIALS
For the quarter ended 30-Jun-2015, the company has reported Standalone sales of Rs. 4465.50 Cr., up 1.81% from last quarter Sales of Rs. 4385.95 Cr. and down -6.41% from last year same quarter Sales of Rs. 4771.44 Cr. Company has reported net profit after tax of Rs. 1435.17 Cr. in latest quarter.
|
Yearly Financial Statement |
2012 |
2013 |
2014 |
2015 |
2016 E |
2017 E |
|
Net Sales |
20830.55 |
25581.06 |
32143.66 |
36701.22 |
42705.54 |
49692.17 |
|
Other Income |
206.50 |
306.61 |
677.40 |
1065.99 |
1100.00 |
1150.00 |
|
Total Income |
21037.05 |
25887.67 |
32821.06 |
37767.21 |
43805.54 |
50842.17 |
|
Total Expenditure |
17135.38 |
19875.40 |
24108.37 |
28155.17 |
32656.70 |
37902.45 |
|
EBIDTA |
3901.67 |
6012.27 |
8712.69 |
9612.04 |
10868.88 |
12647.03 |
|
Interest |
142.63 |
105.62 |
114.50 |
91.23 |
105.82 |
122.81 |
|
Depreciation |
549.24 |
636.76 |
680.86 |
403.75 |
456.54 |
531.23 |
|
EBIT |
3352.43 |
5375.51 |
8031.83 |
9208.29 |
10412.34 |
12115.80 |
|
PBT |
3209.80 |
5269.89 |
7917.33 |
9117.06 |
10586.48 |
12285.67 |
|
Tax |
782.72 |
1225.31 |
1571.89 |
1815.11 |
2201.99 |
2641.42 |
|
Deferred Tax |
0.00 |
0.00 |
-162.32 |
0.00 |
|
|
|
Reported Profit After Tax |
2427.08 |
4044.58 |
6507.76 |
7301.95 |
8384.49 |
9644.25 |
|
Minority Interest After NP |
0.07 |
4.28 |
18.31 |
24.78 |
28.74 |
33.36 |
|
Profit/Loss of Associate Company |
-4.31 |
-0.21 |
20.06 |
39.90 |
46.28 |
53.71 |
|
Adjusted Profit After Extra-ordinary item |
2422.70 |
4040.09 |
6509.51 |
7317.07 |
8402.03 |
9664.60 |
|
|
|
|
|
|
|
|
|
EPS (Unit Curr.) |
35.06 |
58.15 |
93.18 |
52.09 |
59.59 |
68.54 |
- Share :


Post a Comment
|
DISCLAIMER |
This report is only for the information of our customers. Recommendations, opinions, or suggestions are given with the understanding that readers acting on this information assume all risks involved. The information provided herein is not to be construed as an offer to buy or sell securities of any kind. ATS and/or its group companies do not as assume any responsibility or liability resulting from the use of such information.