HCL TECH LTD
HCL Technologies Limited - Company Profile
Founded in 1976, HCL Technologies Limited (“HCL” or the “HCL Technologies”) is headquarters in Noida, India and provides a range of software services, Business Process Outsourcing (BPO) services, and infrastructure product and management services to its clients in India, the United States, Europe, and in many other geographies. Leveraging its extensive global offshore infrastructure and network of offices in 31 countries, the Company provide holistic, multi-service delivery in industries including Banking and Financial Services (BFSI), manufacturing, consumer services and healthcare. The HCL team comprises 90,000 professionals from diverse nationalities. The Company has global strategic alliances with Microsoft, Cisco, HP, EMC and SAP. 56.9 % of the overall revenue of the Company comes from U.S.,
HCL Technologies Limited - STOCK INFORMATION
|
STOCK PRICE |
1589.20 |
|
TARGET PRICE |
1630-1650 |
|
SECTOR |
COMPUTERS - SOFTWARE |
|
SYMBOL (AT NSE) |
HCLTECH |
|
ISIN |
INE860A01027 |
|
FACE VALUE (IN RS.) |
2.00 |
|
BSE CODE |
532281 |
HCL Technologies Limited - STOCK FUNDAMENTALS
|
MARKET CAP |
111,452.22 |
|
BOOK VALUE |
224.18 |
|
EPS - (TTM) (IN RS. CR.) |
90.78 |
|
P/E |
17.48 |
|
INDUSTRY P/E |
22.74 |
INVESTMENT RATIONALE
HCL Technologies Ltd signed new deals worth $1 billion TCV during Q1 taking LTM order booking to $4 billion+ (FY14 total was >$5 billion). Noticeably, though this is the eighth consecutive quarter where the company signed deals in excess of $1 billion, conversion rates continue to moderate. We believe, growth rates could taper going ahead, given the company’s admission of 1) reduced addressable opportunity ($45 billion vs.$60 billion earlier), 2) rising competitive intensity and 3) moderating win rates from historical highs of 25%. Implies winning larger deals is now imperative than ever before to sustain IMS growth acceleration.
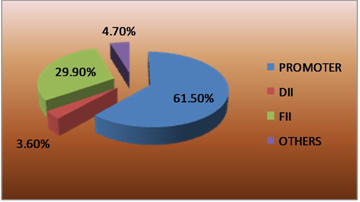
SHAREHOLDING PATTERN
OUTLOOK AND VALUATION
Q1FY15 constant currency growth (CC, 3.2% QoQ) was driven by ER&D services (8.1% QoQ) and infrastructure services (IMS, 3.6%) with healthy recovery in enterprise system integration (5.1%, likely led by business intelligence, analytics services and Gen2 markets). HCLT signed new deals worth $1 billion TCV during Q1 taking LTM order booking to $4 billion+ (FY14 total to >$5 billion). We continue to believe that HCLT’s current one-year forward PE multiple is inexpensive considering it represents a modest 10% premium relative to its five-year (FY09-14) average (12.5x), despite delivering 38% earnings CAGR (25% revenue growth, average 18.2% EBIT margins) over the same period and expected revenue, earnings CAGR of 12% each during FY14- 16E (average 23.1% margins in FY15-16E). Consequently, we continue to value HCLT at 15x FY16E EPS of 113 to arrive at our target price of 1650.
RESULTS (Quarterly )(Rs CR.)
|
SEP' 14 |
JUN' 14 |
MAR' 14 |
DEC' 13 |
SEP' 13 |
|
|
Sales |
4,054.40 |
4,771.44 |
4,045.91 |
3,836.21 |
3,843.81 |
|
Operat- ing profit |
1,797.40 |
2,414.22 |
1,711.17 |
1,562.48 |
1,623.02 |
|
Interest |
21.49 |
22.46 |
19.18 |
21.54 |
18.47 |
|
Gross profit |
2,140.99 |
2,627.03 |
1,861.92 |
1,680.59 |
1,718.82 |
|
EPS (Rs) |
23.99 |
28.33 |
20.20 |
18.57 |
18.50 |
TECHNICAL VIEW
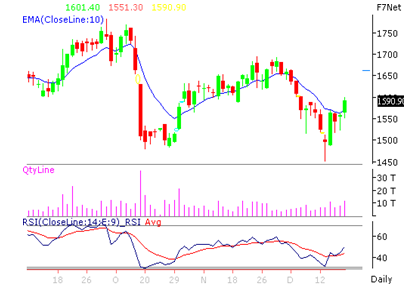
HCL TECH is looking strong on charts. We advise to buy around 1560-1590 with stop loss of 1520 for the targets of 1630-1650 levels. RSI is also showing upside momentum in it on daily charts.
|
SYMBOL |
VALUE |
ACTION |
|
RSI(14) |
57.998 |
BUY |
|
STOCH(9,6) |
66.830 |
BUY |
|
STOCHRSI(14) |
100.000 |
OVERBOUGHT |
|
MACD(12,26) |
-25.750 |
SELL |
|
ADX(14) |
38.468 |
BUY |
|
WILLIAMS %R |
-8.146 |
OVERBOUGHT |
|
CCI(14) |
146.9117 |
BUY |
|
ATR(14) |
32.7464 |
HIGH VOLATILITY |
|
HIGH/LOWS(14) |
41.6071 |
BUY |
|
ULTIMATE OSCILLATOR |
61.929 |
BUY |
|
ROC |
2.394 |
BUY |
|
BULL/BEAR POWER()13 |
66.3200 |
BUY |
|
BUY: 8 SELL:1 NEUTRAL: 2 |
SUMMARY : STRONG BUY |
|
Our Other Recommendation for Next Week
|
SCRIP |
ACTION |
CMP |
ENTRY |
SL |
TGT |
TIME FRAME |
|
HEXAWARE |
BUY |
202.50 |
200-202 |
197 |
205-208 |
ONE WEEK |
|
JSW ENERGY |
BUY |
102.55 |
101-102 |
98 |
104-107 |
ONE WEEK |
|
KPIT TECH |
BUY |
204.75 |
202-205 |
192 |
212-222 |
ONE WEEK |
|
GLENMARK |
SELL |
752.35 |
760-780 |
800 |
740-720 |
ONE WEEK |
|
KOTAK BANK |
SELL |
1240.35 |
1240-1250 |
1280 |
1210-1200 |
ONE WEEK |
Performance of Previous Week
|
SCRIP |
LOT |
ACTION |
ENTRY |
SL |
TGT |
P&L |
REMARK |
CLOSE/LOW/HIGH |
|
RELINFRA |
500 |
SELL |
530-550 |
580 |
505-470 |
27000.00 |
FIRST TGT HIT |
494.20 / 475.30 |
|
M&M |
250 |
SELL |
1260-1280 |
1300 |
1240-1220 |
10000.00 |
BOTH TGT HIT |
1225.80 / 1205.80 |
|
LIC HOUSING |
1000 |
SELL |
440-445 |
450 |
435-428 |
23000.00 |
BOTH TGT HIT |
422.90 / 378.40 |
|
TITAN |
1000 |
SELL |
380-385 |
392 |
372-362 |
9000.00 |
NEAR TGT |
376.65 / 374.20 |
|
POWER GRID |
2000 |
SELL |
136-138 |
142 |
132-128 |
8000.00 |
FIRST TGT HIT |
136.20 / 130.25 |
|
MARUTI |
125 |
BUY |
3350-3400 |
3300 |
3450-3500 |
-6250.00 |
SL TRG |
3365.30 / 3261.00 |
|
NET PROFIT |
|
|
|
|
|
70750.00 |
|
|
- Share :


Post a Comment
|
DISCLAIMER |
This report is only for the information of our customers. Recommendations, opinions, or suggestions are given with the understanding that readers acting on this information assume all risks involved. The information provided herein is not to be construed as an offer to buy or sell securities of any kind. ATS and/or its group companies do not as assume any responsibility or liability resulting from the use of such information.