Greenply Industries Ltd.
|
Current price BSE |
991.50 |
|
Sector |
PLYWOODS |
|
No of shares |
241.46(in millions) |
|
52 week high |
2176.00 |
|
52 week low |
344.25 |
|
BSE Sensex |
28376.38 |
|
Nifty |
8723.30 |
|
Average Volume |
15973 |
|
BSE Code |
526797 |
|
NSE Symbol |
GREENPLY |
Greenply Industries Ltd - Company Overview
Greenply Industries Ltd. (GIL) is a manufacturer and marketer of interior infrastructure products, based in India. Greenply Industries Limited, an interior infrastructure company, manufactures, markets, and distributes plywood, laminates, particleboards, and allied products primarily in India. Its interior infrastructure products include decorative veneers and laminates, plywood, block boards, flush doors, medium density fiberboards, and restroom cubicles, laminated flooring and UV coated panels, and others.
Greenply Industries Ltd offers its products under the Greenlam, Greenply Plywood, Green Club Premium Ply, Greenlam Laminates, Green Decowood, Ecotec, and Green Panelmax brand names through 46 marketing offices and a network of approximately 15,000 distributors, dealers, sub-dealers, and retailers. Greenply Industries Limited also exports its products to North America, Latin America, Europe, the Middle East, and the Asia Pacific. The company markets its products in 65 countries which include Thailand, Indonesia, Canada, Singapore, UAE, Australia, Saudi Arabia, Russia and China.
Greenply Industries Ltd was formerly known as Mittal Laminates Private Limited and changed its name to Greenply Industries Limited in 1995. Greenply Industries Limited was founded in 1990 and is headquartered in Kolkata, India.
The current market capitalization stands at Rs 2,375.02 crore. The company has reported a standalone sales of Rs 390.52 crore and a Net Profit of Rs 26.14 crore for the quarter ended Dec 2014.
Greenply Industries Ltd - Share Holding Pattern
|
Category |
No. of Shares |
Percentage |
|
Promoters |
13,275,000 |
55.00 |
|
General Public |
4,700,889 |
19.48 |
|
Foreign Institutions |
3,689,799 |
15.29 |
|
NBFC and Mutual Funds |
1,913,642 |
7.93 |
|
Other Companies |
504,179 |
2.09 |
|
Foreign - NRI |
48,049 |
0.20 |
|
Others |
4,816 |
0.02 |
Greenply Industries Ltd - Financial Details
-
Market Cap (Rs Cr) – 2375.02
-
Company P/E (x) – 18.27
-
Industry P/E (x) –40.06
-
Book Value (Rs) – 241.84
-
Price / BV (x) – 4.04
-
Dividend (%) – 60%
-
EPS (TTM) – 53.95
-
Dividend Yield (%) – 0.30%
-
Face Value (Rs) – 5
Industry Overview
The segment in which Greenply Ltd. operates, plywood and laminates, can be classified as discretionary spending in the housing segment. Demand-supply dynamics in this segment greatly depend on real estate- sector growth/churn and changing lifestyle preferences. General economic growth and demographic factors have a huge bearing. Improving income streams/levels, nuclear family structure, and easier financing options have propelled growth of housing-stock in India.
The size of the plywood sector is estimated at 160bn, with laminates at `42bn, and has registered a 6% CAGR in the past five years. Within this, the organised sector accounts for a mere 30%. Improving quality preferences and well-marked brand equity are now slowly heralding a shift towards branded products in the market; and that is accentuating the shift towards the organised players. Another dogma of the sector is that most dealing in the industry is in cash, even with end users. Of late, however, with the per-household ticket size increasing, the shift towards the banking system by end users is playing a role in tilting the balance in favour of regulated operators.
Overall, the sector is expected to register a 6% CAGR in the coming five years. Within this, the organized segment would outstrip sector growth at 25-30% as brand equity, quality, amongst others, make their impact felt on the dynamics of demand. The GST implementation could further erode the share of the unorganized sector.
Greenply Industries a dominant operator in the organised plywood market and accounts for ~25% of the organised market share. Laminate is used to provide an aesthetic look and improve the finishing to wooden furniture. Hence, it has a high degree of correlation with the plywood market, and the latter has a huge influence on the laminate market. The peculiarity of this sector is that customer involvement is low so too are brand awareness and product knowledge. Other than being overlaid on plywood, laminates are also utilised in readymade furniture, largely from pre-laminated particle board and MDF. Laminates is now a `42bn industry and seeing an 8% CAGR..
Balance Sheet
|
|
Mar '14 |
Mar '13 |
Mar '12 |
Mar '11 |
Mar '10 |
|
Sources Of Funds |
|
|
|
|
|
|
Total Share Capital |
12.07 |
12.07 |
12.07 |
12.07 |
11.05 |
|
Equity Share Capital |
12.07 |
12.07 |
12.07 |
12.07 |
11.05 |
|
Reserves |
571.06 |
465.06 |
359.40 |
310.69 |
260.46 |
|
Networth |
583.13 |
477.13 |
371.47 |
322.76 |
271.51 |
|
Secured Loans |
381.16 |
354.56 |
345.56 |
434.49 |
366.57 |
|
Unsecured Loans |
168.34 |
178.44 |
255.32 |
85.30 |
40.83 |
|
Total Debt |
549.50 |
533.00 |
600.88 |
519.79 |
407.40 |
|
Total Liabilities |
1,132.63 |
1,010.13 |
972.35 |
842.55 |
678.91 |
|
Application Of Funds |
|
|
|
|
|
|
Gross Block |
937.67 |
857.11 |
780.01 |
727.80 |
634.98 |
|
Less: Revaluation Reserves |
0.00 |
0.00 |
0.00 |
0.34 |
0.95 |
|
Less: Accum. Depreciation |
252.37 |
205.32 |
160.72 |
123.86 |
92.21 |
|
Net Block |
685.30 |
651.79 |
619.29 |
603.60 |
541.82 |
|
Capital Work in Progress |
94.99 |
23.37 |
13.50 |
10.54 |
13.49 |
|
Investments |
31.29 |
17.53 |
8.75 |
8.75 |
4.13 |
|
Inventories |
382.88 |
327.91 |
277.29 |
229.28 |
199.75 |
|
Sundry Debtors |
350.28 |
343.21 |
290.87 |
212.75 |
151.13 |
|
Cash and Bank Balance |
10.80 |
16.28 |
12.16 |
7.91 |
5.46 |
|
Total Current Assets |
743.96 |
687.40 |
580.32 |
449.94 |
356.34 |
|
Loans and Advances |
167.23 |
145.77 |
91.77 |
80.33 |
61.80 |
|
Fixed Deposits |
0.00 |
0.00 |
0.00 |
5.50 |
13.46 |
|
Total CA, Loans & Advances |
911.19 |
833.17 |
672.09 |
535.77 |
431.60 |
|
Current Liabilities |
559.46 |
488.77 |
321.92 |
307.87 |
304.28 |
|
Provisions |
30.67 |
26.96 |
19.37 |
9.00 |
8.83 |
|
Total CL & Provisions |
590.13 |
515.73 |
341.29 |
316.87 |
313.11 |
|
Net Current Assets |
321.06 |
317.44 |
330.80 |
218.90 |
118.49 |
|
Miscellaneous Expenses |
0.00 |
0.00 |
0.00 |
0.77 |
1.00 |
|
Total Assets |
1,132.64 |
1,010.13 |
972.34 |
842.56 |
678.93 |
|
Contingent Liabilities |
633.65 |
315.36 |
478.57 |
85.65 |
72.52 |
|
Book Value (Rs) |
241.60 |
197.68 |
153.90 |
133.72 |
122.87 |
Profit and Loss Account
|
|
Mar '14 |
Mar '13 |
Mar '12 |
Mar '11 |
Mar '10 |
|
Income |
|
|
|
|
|
|
Sales Turnover |
2,159.52 |
2,000.81 |
1,643.66 |
1,378.33 |
980.12 |
|
Excise Duty |
0.00 |
0.00 |
0.00 |
55.42 |
37.21 |
|
Net Sales |
2,159.52 |
2,000.81 |
1,643.66 |
1,322.91 |
942.91 |
|
Other Income |
6.76 |
6.50 |
5.91 |
-9.20 |
8.21 |
|
Stock Adjustments |
13.58 |
13.97 |
20.70 |
13.14 |
-2.74 |
|
Total Income |
2,179.86 |
2,021.28 |
1,670.27 |
1,326.85 |
948.38 |
|
Expenditure |
|
|
|
|
|
|
Raw Materials |
1,313.84 |
1,214.89 |
1,030.52 |
769.27 |
522.52 |
|
Power & Fuel Cost |
88.96 |
100.16 |
105.51 |
72.98 |
38.76 |
|
Employee Cost |
193.51 |
161.68 |
130.01 |
106.40 |
80.65 |
|
Other Manufacturing Expenses |
0.00 |
0.00 |
0.00 |
7.70 |
5.49 |
|
Selling and Admin Expenses |
0.00 |
0.00 |
0.00 |
242.12 |
184.18 |
|
Miscellaneous Expenses |
318.30 |
280.47 |
231.75 |
12.78 |
10.79 |
|
Total Expenses |
1,914.61 |
1,757.20 |
1,497.79 |
1,211.25 |
842.39 |
|
Operating Profit |
258.49 |
257.58 |
166.57 |
124.80 |
97.78 |
|
PBDIT |
265.25 |
264.08 |
172.48 |
115.60 |
105.99 |
|
Interest |
58.29 |
60.72 |
60.78 |
42.50 |
26.48 |
|
PBDT |
206.96 |
203.36 |
111.70 |
73.10 |
79.51 |
|
Depreciation |
57.57 |
51.99 |
46.77 |
40.99 |
22.02 |
|
Profit Before Tax |
149.39 |
151.37 |
64.93 |
31.85 |
57.24 |
|
PBT (Post Extra-ord Items) |
149.39 |
151.37 |
64.93 |
32.09 |
56.19 |
|
Tax |
34.91 |
37.22 |
11.51 |
5.77 |
6.34 |
|
Reported Net Profit |
114.47 |
114.16 |
53.41 |
25.09 |
49.57 |
|
Total Value Addition |
600.78 |
542.31 |
467.27 |
441.98 |
319.88 |
|
Equity Dividend |
7.24 |
7.24 |
4.83 |
2.41 |
3.31 |
|
Corporate Dividend Tax |
1.23 |
1.23 |
0.78 |
0.39 |
0.55 |
|
Per share data (annualised) |
|
|
|
|
|
|
Shares in issue (lakhs) |
241.36 |
241.36 |
241.36 |
241.36 |
220.97 |
|
Earning Per Share (Rs) |
47.42 |
47.30 |
22.13 |
10.39 |
22.43 |
|
Equity Dividend (%) |
60.00 |
60.00 |
40.00 |
20.00 |
30.00 |
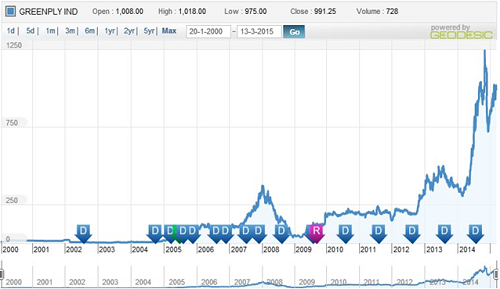
Dividend History
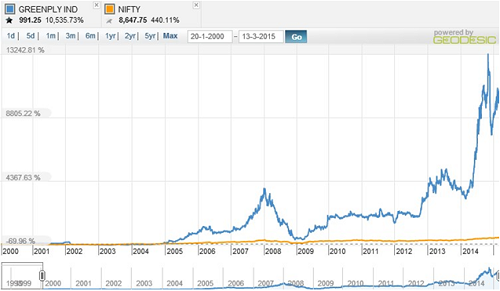
Index and Company Price Movement Comparison
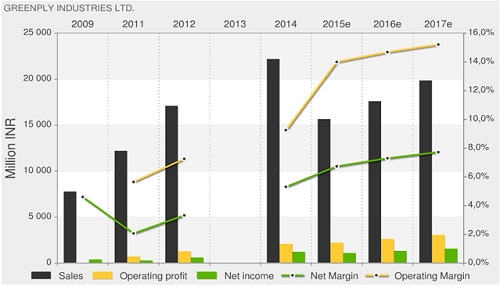
Company Forecast
Technical Indicators
|
Symbol |
Value |
Action |
|
RSI(14) |
62.213 |
Buy |
|
STOCH(9,6) |
69.965 |
Buy |
|
STOCHRSI(14) |
89.825 |
Overbought |
|
MACD(12,26) |
7.000 |
Buy |
|
ADX(14) |
44.590 |
Buy |
|
Williams %R |
-16.134 |
Overbought |
|
CCI(14) |
108.9592 |
Buy |
|
ATR(14) |
18.8429 |
High Volatility |
|
Highs/Lows(14) |
20.8893 |
Buy |
|
Ultimate Oscillator |
54.622 |
Buy |
|
ROC |
210.132 |
Buy |
|
Bull/Bear Power(13) |
54.9540 |
Buy |
Important Ratios (YoY)
-
PBIT – 11.96 v/s 12.87
-
RoCE – 18.33 v/s 20.99
-
RoE – 19.06 v/s 20.39
-
Net Profit Margin – 5.28 v/s 5.68
-
Return on net worth – 19.62 v/s 23.92
-
D/E Ratio – 0.92 v/s 1.12
-
Interest Cover – 3.56 v/s 3.49
-
Current Ratio – 0.91 v/s 0.89
-
Reserves – 571.06 cr v/s 465.06 cr
-
PAT – 114.47 cr v/s 114.16 cr
-
Total assets – 1132.64 cr v/s 1010.13 cr
-
Net sales – 2179.86 cr v/s 2021.28 cr
-
Book Value – 241.10 v/s 197.68
Simple Moving Average
|
Days |
BSE |
NSE |
|
30 |
958.91 |
960.05 |
|
50 |
924.77 |
925.40 |
|
150 |
933.10 |
934.02 |
|
200 |
866.45 |
869.11 |
Investment Rationalize
-
Greenply Industries Ltd. (GIL) is in a healthy financial position with Rs.571.06Cr as reserves and have made significant increase in production capacity to meet increasing market demand.
-
Greenply Industries Ltd have a well diversified product mix with plywood's and MDF and well established network of distributers and retailers.
-
Change in demography pattern and disposable income in Indian population along with increase in numder of nuclear families and increase in per capita expenditure on high quality interiors gives company a good growth opportunity.
-
Demerger of Greenlam Industries from Greenply industries will increase the profitability of the company.
-
Acquisition of raw materials domestically will reduce the logistics expenses significantly and it will add on to the profits.
-
Price to Sales Ratio of the Greenply Industries stands at 0.86% which implies the current market price of the company is still very much fairly valued.
-
Improvement in industrial construction and real estate sector will demand for the products of the company.
-
Revenue is growing in a healthy CAGR of 17.1% and the Gross Profit margin of the company is improving Year on year basis.
-
Improvement in demands for furniture and increase in exports will increase the sales.
- Share :


Post a Comment
|
DISCLAIMER |
This report is only for the information of our customers. Recommendations, opinions, or suggestions are given with the understanding that readers acting on this information assume all risks involved. The information provided herein is not to be construed as an offer to buy or sell securities of any kind. ATS and/or its group companies do not as assume any responsibility or liability resulting from the use of such information.