Godrej Properties Ltd.
|
Industry |
Market Price |
Recommendation |
Target |
|
Real Estate |
735.60 |
sell |
|
Godrej Properties Ltd, a real estate company is engaged in construction and real estate development. The firm focuses on developing residential, commercial, and township projects spread across 11.89 million square meters in over 10 cities. The GPL’s commercial projects include The Trees, Mumbai, Godrej Eternia, Chandigarh; Godrej Waterside, Kolkata, and Godrej BKC, Mumbai. Godrej Industries Ltd is the promoter holding company of Godrej Properties.
Godrej Properties Ltd - Investment Summary
|
CMP (Rs) |
735.60 |
|
52 Week H/L |
917.00 /462.00 |
|
Market Cap (Cr) |
16,465.38 |
|
Face Value (Rs) |
5.00 |
|
Promoter Holding (%) |
70.83 |
|
Non-Promoter Holding (%) |
29.17 |
|
Total (%) |
100.00 |
-
Company has a consistent low return ROE & ROCE over the last 5 years
-
Exit from key cities has lead to lesser diversification
-
GST & RERA have negatively impacted the industry-leading to a slowdown.
-
Leveraged capital structure and high inventory have pulled down the profitability
Godrej Properties Ltd - Financial Summary
|
Particulars(Rs. Cr) |
FY18 |
FY17 |
FY16 |
FY15 |
FY14 |
|
Total Assets |
7,122.19 |
7,180.86 |
6,578.46 |
7,363.05 |
6,146.72 |
|
Total Revenue |
2,390.67 |
1,701.38 |
2,252.06 |
1,926.56 |
1,254.22 |
|
Profit after Tax |
228.94 |
175.12 |
143.42 |
235.58 |
236.29 |
|
EPS( Rs) |
11.00 |
10.00 |
8.00 |
10.00 |
9.00 |
Godrej Properties Ltd - Outlook and Valuation
Real estate firm Godrej Properties Ltd reported its net profit dropped 66.4% to Rs25.94 crore in the quarter ended 31 December, primarily due to a rise in expenses during the period. The company posted a 22% increase in total income to Rs674.31 crore yoy. Total expenses in the 3rd quarter rose 42.5% to Rs622.79 crore from Rs436.76 crore a year earlier. The company is focusing on 4 prime metros and is gradually exiting from all other markets which may increase the risk of concentration and may impact negatively. Diversifying a business mitigates risk and uncertainty. The company returns on equity and ROCE is also low from last 5 years. Some of Godrej’s projects have ended up getting extremely delayed on a regulatory approval front. Demonetization and GST, real estate space took the biggest hit. Considering all the points, we recommend avoid for Godrej Properties Ltd.
Company overview:
Godrej Properties Ltd operates as a real estate development company in India. The company mainly focuses on residential, commercial, and township developments. The GPL's residential portfolio consists of various types of accommodations, commercial portfolio comprises office space catering to Indian and international companies, IT parks for the requirements of IT/ITES companies, and retail spaces; and the township portfolio includes integrated townships consisting of residential and commercial developments. Godrej Properties Ltd has operations in the Mumbai Metropolitan region, Pune, Bengaluru, Kolkata, Hyderabad, Ahmedabad, Mangalore, Chandigarh, Chennai, and Kochi. The company is based in Maharashtra.
In the year 1990, the company was established as a real estate development company within the Godrej Group business. The company was originally incorporated on February 8, 1985 as Sea Breeze Constructions and Investments Pvt Ltd. In the year 1990, the name of the company was changed to Godrej Properties and Investments Pvt Ltd. In the year 1991, the company changed their status to a public limited company.
In 1991, the company entered into its first project. The GPL initially concentrated its operations in the Mumbai Metropolitan region and later expanded to include other cities such as Pune, Bengaluru, Kolkata, Hyderabad, Ahmedabad, Mangalore, Chandigarh, Chennai and Kochi.
The company changed its name from Godrej Properties Ltd and Investments Pvt Ltd to Godrej Properties Ltd with effect from November 23, 2004. In the year 2005, they executed agreement for the first project in Kolkata, namely Godrej Waterside. In the year 2006, they made a tie up with Rallis India Ltd for their first project in Hyderabad.
On 8 June 2018 Godrej Properties Ltd. (GPL) announced that it has completed the allotment of 1.27 crore equity shares of Rs 5 each to GAMNAT Pte. Ltd. a GIC- managed investment firm. The total capital raised from this issue is Rs 1000 crore.

Management Profile
|
Key Personnel |
Designation and Experience |
|
Mr. Adi godrej |
Chairman: Adi Godrej, is the chairman and chairman Emeritus of Godrej Properties. He is also the chairman of the board of the Indian School of Business and a Former President of the Confederation of Indian Industry. Mr. Adi got the Padma Bhushan Award, one of India’s highest civilian awards, from the Government of India. He received the Global Citizen Award from the Clinton Foundation in 2016. He received his Bachelors degree in Engineering and an MBA from the Massachusetts Institute of Technology. |
|
Mr. Pirojsha godrej |
Executive Chairman: In 2012, Pirojsha took over as CEO of Godrej Properties Ltd. Mr. Pirojsha has led the company through a phase of rapid growth through which the company has established itself as one of India's leading and fastest-growing real estate developers. He completed his graduation from the Wharton School of Business in 2002 and completed his Masters in International Affairs from Columbia University in 2004. In 2008, he went on to complete an MBA from Columbia Business School before rejoining GPL as Executive Director. In 2010, Pirojsha led the initial public offering of the company through which Godrej Properties raised US$ 100 million. |
|
Mr. Mohit malhotra |
Managing Director & CEO: Mohit Malhotra was appointed as the managing director & chief executive officer at Godrej Properties. In 2010, he joined Godrej Properties Ltd. Mr. Mohit first headed business development for the company and has since taken on larger leadership responsibilities. Prior to joining this company, he has worked with several leading companies in the FMCG, Private Equity, and Real Estate Development space. Mohit completed his Post Graduate Diploma from the Indian Institute of Management, Calcutta. |
|
Mr. Jamshyd N Godrej |
Independent Director: Mr. Jamshyd, chairman of the board of Godrej & Boyce Manufacturing Company Limited. Mr. Jamshyd is the cousin of the Godrej clan's billionaire patriarch, Adi Godrej. He completed his graduation in Mechanical Engineering from Illinois Institute of Technology, USA. |
Key Ratios
|
Key Ratios |
FY18 |
FY17 |
FY16 |
FY15 |
FY14 |
|
Debt-Equity Ratio |
1.65 |
1.99 |
1.77 |
1.78 |
1.35 |
|
Current Ratio |
1.28 |
1.34 |
1.61 |
1.48 |
1.53 |
|
Inventory Turnover Ratio (x) |
0.81 |
0.40 |
0.54 |
0.39 |
0.32 |
|
Total Asset Turnover Ratio (%) |
26.52 |
22.04 |
32.26 |
25.03 |
19.18 |
|
PBDIT Margin (%) |
26.31 |
23.44 |
12.53 |
18.48 |
30.32 |
|
PBIT Margin (%) |
25.45 |
22.53 |
11.86 |
17.94 |
29.83 |
|
ROCE (%) |
8.53 |
8.32 |
5.40 |
7.21 |
6.97 |
|
RONW (%) |
10.48 |
10.32 |
8.98 |
10.33 |
8.89 |
|
Price/Book Value (x) |
7.01 |
4.16 |
3.63 |
2.71 |
2.36 |
|
EV/EBITDA (x) |
38.43 |
32.90 |
35.40 |
22.98 |
16.75 |
|
Market Cap/Sales |
8.32 |
5.27 |
3.02 |
2.72 |
3.59 |
Recommendation Rationale
Godrej Properties has exited the Hyderabad market and is proposed to move out of Kochi and Mangaluru residential projects as well, as it looks to penetrate deeper in four core markets. Godrej Properties is considering exiting from the Hyderabad market. Godrej Properties has maintained that its strategy is to become the market leader in India’s top four real estate markets like Mumbai, Pune, National Capital Region (NCR) and Bengaluru. As a result, it is exiting from all its projects in Hyderabad. Godrej properties has completely exited from Godrej & Boyce JV in the last quarter of CY17. The company is currently focused on 4 cities and is gradually exiting from all other markets which may increase the risk of concentration and may impact negatively. Diversifying a business mitigates risk and uncertainty. As per data by property consultant ANAROCK, Bengaluru, Hyderabad and Chennai saw 77% increase in new residential supply in 2018, NCR 16%, MMR and Pune 17%. Chennai led new launch supply with 98% increase, Bengaluru 91%, Hyderabad 43%. Bengaluru, Hyderabad and Chennai saw 20% increase in housing sales, 18% in North, and 15% in West.
Company has a consistent low return ROE & ROCE over the last 5 years.
Some of Godrej’s projects have ended up getting extremely delayed on a regulatory approval front. Some of them no longer make sense given the company’s current priorities. Often regulatory approvals are the top concerns of any of these projects which haven’t launched for a long time and their efforts are certainly to achieve closure on those projects.
The liquidity has been a challenge for the real estate sector even before the current non-banking financial company crisis. Developers have been forced to look at new source of funding as accessing capital from traditional line has become difficult. GPL follows the asset-light model where most of the projects are under joint development agreements (JDA) or joint ventures, wherein GPL enters into a revenue/profit sharing arrangement with land owners to develop the land. This strategy is good to spread risk in an overheated market. However, it will impact adversely during good times since the profits will have to be shared with the land owner.
Gross debt was around Rs 3,700 crore as on March 31, 2018. Sizeable debt is largely due to deposits given to land owners in the past as well as cost incurred on new projects, where returns will be generated over the medium term. Overall cash and cash equivalent as on March 31, 2018 was around Rs 870 crore. The company's net worth was negatively impacted by Rs 770 crore, post adoption of IND-AS 115 (adoption of project completion method instead of percentage completion method which was being used earlier for accounting purposes, for ongoing projects). However, the same is expected to be recouped as and when the existing projects are completed. GPL has reported negative operating profitability of -0.2% in FY2018 primarily owing to one-time write-off and higher overheads.
Cyclicality in the real estate sector could result in fluctuations in cash inflow and volatility in sales. In contrast, cash outflow, such as for debt servicing, is relatively fixed. Any decline in demand in ongoing projects could result in lower collections and expose the group to refinancing risk.
As the Indian government announced demonetization and GST, real estate space took the biggest hit. While the sector is struggling to come out of the shambles, the Real Estate Sentiment Index works as a light at end of the tunnel for all the real estate companies.
Industry Overview
The Indian real estate sector is a globally-recognized sector. In India, real estate is the second largest employer after agriculture and is slated to grow at a rate of 30% over the next decade. The real estate sector comprises 4 sub-sectors housing, retail, hospitality, and commercial. The growth of real estate sector is complemented by the growth of the corporate environment and the demand for office space as well as urban and suburban accommodations. In terms of direct, indirect and induced effects in all sectors of the economy, the Indian construction industry ranks 3rd among the 14 major sectors.
India is expected to witness an upward rise in the number of real estate deals in 2018, on the back of policy changes that have made the market more transparent. India stood third in the US Green Building Council’s ranking of the top 10 countries for LEED-certified buildings, with over 752 LEED-certified projects across 20.28 million gross square meters of space. The construction development sector in India received FDI equity inflows to the tune of US$24.67 billion in the period between April 2000 and December 2017.
According to a CLSA report, there is currently no listed developer achieving sales of US$1bn per annum in India’s US$100bn+ residential market. Fragmentation is high, not just at a national level, but at a city level too. However, disruption- with demonetization in 2016 and the Real Estate Regulatory Act (RERA) reform in 2017 has triggered accelerated consolidation. Customer preferences also have shifted towards better quality and branded developments. Access to cheaper capital has gained importance as working capital requirements rise. The organized sector should be able to more than double its market share of the residential property market, to nearly 20% over the next five to seven years.
The CLSA report further compares the Indian and the Chinese real estate market. The top 10 Chinese developers accounted for 22% of residential property sales in 2016, double the level of 11% in 2008. The top developers have steadily utilized their balance-sheet advantages and delivery capabilities to scale- up. In 2016, the top-three Chinese developers together sold US$150bn of properties, accounting for 11% of the market share. As delivery capabilities and balance sheets start to matter more in India, it expects a similar consolidation to unfold in India as well.
The Indian residential real estate sector is at the cusp of a gradual demand revival, aided by affordability at a 15-year high and new buyer-friendly regulation that has increased the confidence of property buyers. Improvement in the current subdued job creation/income growth outlook could lead to even faster growth. Developers with a scalable business model are better placed to grow market share in a regulatory environment that demands greater accountability and transparency from developers.
Residential real estate market
The Indian residential market breached new lows in terms of supply and sales in CY18. Clocking the largest percentage drop in supply volumes during this decade, the annual supply levels in the Indian real estate residential market in 2017 stood at one-fourth of those in 2015. The NCR was the most affected market with its annual supply volume at just 7% of its decadal high. Total sales volume in the top eight cities dropped by 7% in CY2017 to 0.23 million units, according to property research firm Knight Frank.
The Indian real estate market is expected to reach US$180 billion by 2020 from US$126 billion in 2015. The emergence of nuclear families, rapid urbanization, and rising household income are likely to remain the key drivers for growth in all spheres of real estate, including residential, commercial, and retail. More than 70% of India’s GDP will be contributed by the urban areas while the overall housing sector is expected to contribute 11% to India’s GDP by 2020. Private equity investments in real estate are estimated to grow to US$ 100 billion by 2026 with Tier-I and II cities being the prime beneficiaries. SEBI has approved the REIT platform that will help create an opportunity worth H1.25 trillion in the Indian market over the next few years. The growing flow of FDI into Indian real estate is encouraging transparency. Developers, in order to attract funding, are revamping their accounting and management systems to meet due diligence standards.
RERA and its implications
A major slowdown in residential property markets from 2013 onwards, combined with poor customer experience with disorganized and unscrupulous developers has led to significant government reforms, the landmark one being the implementation of the Real Estate Regulation Act, 2016 (RERA) in 2017. RERA is customer-driven and provides a major boost to transparency, increases working capital requirements, and significantly raises the property sector’s overall entry barriers. Its objective is to enhance customer confidence in purchasing under-construction real estate projects comes at a cost to developers; higher working capital and the risk of significant liabilities. RERA safeguards the customers in two important ways: developers must secure all project approvals before launching any sales process, and 70% of all project cashflow – excluding land costs – must be spent on construction. Both these initiatives make it difficult for the developers to rotate capital into multiple projects. Prior to RERA, developers used to front-load customer cashflow vis-à-vis the actual construction-expenditure outgo.
GST impact
Real estate sector will invite GST at the rate of 12 percent with a full input tax credit. The real estate sector will comprise the construction of a complex, building, civil structure, or a part thereof, intended for sale to a buyer, wholly or partly, according to the schedule of Goods and Services Tax (GST) rates for services as approved by the council. The land value is included in the amount charged from the service recipient. These will be charged at 12 percent with the full input tax credit. In other words, it means all under-construction properties will invite a GST of 12 percent. But, it will not be applicable for ready-to-move-in properties. Yet, there are still some variations for under-construction properties and confusion regarding the same. Given the weak property-pricing cycle, end- result has been a proliferation of “GST-Free” with developers reducing their own net realizations. The major positive impact has been that forcing developers to take responsibility for input taxes will make their entire supply chain far more organized, as the prevalence of cash transactions will fall.
Peer Review
|
Name |
Last Price |
Market Cap. |
Sales Turnover |
Net Profit |
Total Assets |
|
DLF |
159.75 |
28,506.99 |
3,055.90 |
365.20 |
27,080.42 |
|
Godrej Prop |
736.30 |
16,885.04 |
955.83 |
240.85 |
5,934.67 |
|
Oberoi Realty |
457.30 |
16,627.53 |
974.19 |
417.16 |
5,336.78 |
|
Phoenix Mills |
578.45 |
8,866.86 |
397.21 |
154.83 |
3,195.52 |
|
HUDCO |
39.05 |
7,817.42 |
4,075.42 |
799.06 |
43,877.97 |
|
Prestige Estate |
199.85 |
7,494.38 |
2,992.50 |
232.00 |
8,739.30 |
|
Delta Corp |
224.45 |
6,081.21 |
375.80 |
104.56 |
1,672.81 |
|
Sunteck Realty |
348.60 |
5,101.30 |
175.73 |
123.59 |
1,880.86 |
Profit and Loss
|
Particulars (Rs. Cr) |
FY18 |
FY17 |
FY16 |
FY15 |
FY14 |
|
INCOME |
|
||||
|
Revenue From Operations [Gross] |
1,699.73 |
1,427.32 |
2,001.31 |
1,742.88 |
1,074.93 |
|
Revenue From Operations [Net] |
1,699.73 |
1,427.32 |
2,001.31 |
1,742.88 |
1,074.93 |
|
Other Operating Revenues |
189.47 |
155.61 |
121.30 |
100.21 |
104.28 |
|
Total Operating Revenues |
1,889.20 |
1,582.93 |
2,122.61 |
1,843.09 |
1,179.21 |
|
Other Income |
501.47 |
118.45 |
129.45 |
83.47 |
75.01 |
|
Total Revenue |
2,390.67 |
1,701.38 |
2,252.06 |
1,926.56 |
1,254.22 |
|
EXPENSES |
|
||||
|
Operating And Direct Expenses |
1,468.66 |
1,080.90 |
1,734.16 |
1,486.41 |
838.08 |
|
Employee Benefit Expenses |
138.42 |
92.84 |
44.98 |
35.48 |
25.30 |
|
Finance Costs |
150.13 |
103.82 |
40.57 |
4.73 |
4.48 |
|
Depreciation And Amortisation Expenses |
16.13 |
14.50 |
14.19 |
10.01 |
5.77 |
|
Other Expenses |
286.52 |
156.50 |
206.83 |
63.96 |
33.21 |
|
Total Expenses |
2,059.86 |
1,448.56 |
2,040.73 |
1,600.59 |
906.84 |
|
Profit/Loss Before Exceptional, ExtraOrdinary Items And Tax |
330.81 |
252.82 |
211.33 |
325.97 |
347.38 |
|
Profit/Loss Before Tax |
330.81 |
252.82 |
211.33 |
325.97 |
347.38 |
|
Current Tax |
101.47 |
109.77 |
65.60 |
99.68 |
115.62 |
|
Deferred Tax |
0.40 |
-32.07 |
2.31 |
-2.23 |
2.13 |
|
Total Tax Expenses |
101.87 |
77.70 |
67.91 |
90.39 |
111.09 |
|
Profit/Loss After Tax And Before ExtraOrdinary Items |
228.94 |
175.12 |
143.42 |
235.58 |
236.29 |
|
Profit/Loss From Continuing Operations |
228.94 |
175.12 |
143.42 |
235.58 |
236.29 |
|
Profit/Loss For The Period |
228.94 |
175.12 |
143.42 |
235.58 |
236.29 |
|
EARNINGS PER SHARE |
|
||||
|
Basic EPS (Rs.) |
11.00 |
10.00 |
8.00 |
10.00 |
9.00 |
|
Diluted EPS (Rs.) |
11.00 |
10.00 |
8.00 |
10.00 |
9.00 |
Godrej Properties Ltd - Balance Sheet
|
Particulars (Rs. Cr) |
FY18 |
FY17 |
FY16 |
FY15 |
FY14 |
|
Equity Share Capital |
108.24 |
108.18 |
108.13 |
99.68 |
99.12 |
|
Total Share Capital |
108.24 |
108.18 |
108.13 |
99.68 |
99.12 |
|
Reserves and Surplus |
2,132.05 |
1,895.55 |
1,656.69 |
1,747.19 |
1,694.28 |
|
Total Reserves and Surplus |
2,132.05 |
1,895.55 |
1,656.69 |
1,747.19 |
1,694.28 |
|
Total Shareholders Funds |
2,240.29 |
2,003.73 |
1,764.82 |
1,846.87 |
1,793.40 |
|
NON-CURRENT LIABILITIES |
|
||||
|
Long Term Borrowings |
500.00 |
474.76 |
500.00 |
567.06 |
286.09 |
|
Deferred Tax Liabilities [Net] |
0.59 |
0.20 |
0.00 |
0.00 |
0.00 |
|
Other Long Term Liabilities |
0.00 |
0.00 |
662.55 |
1.42 |
1.12 |
|
Long Term Provisions |
11.33 |
6.54 |
5.49 |
4.59 |
2.88 |
|
Total Non-Current Liabilities |
511.92 |
481.50 |
1,168.04 |
573.07 |
290.08 |
|
CURRENT LIABILITIES |
|
||||
|
Short Term Borrowings |
3,202.86 |
3,505.65 |
2,617.46 |
2,722.73 |
2,142.94 |
|
Trade Payables |
312.63 |
517.06 |
594.89 |
713.55 |
704.30 |
|
Other Current Liabilities |
851.03 |
672.58 |
433.11 |
1,218.89 |
956.86 |
|
Short Term Provisions |
3.46 |
0.34 |
0.14 |
60.04 |
56.08 |
|
Total Current Liabilities |
4,369.98 |
4,695.63 |
3,645.60 |
4,715.21 |
3,860.17 |
|
Total Capital And Liabilities |
7,122.19 |
7,180.86 |
6,578.46 |
7,363.05 |
6,146.72 |
|
ASSETS |
|
||||
|
NON-CURRENT ASSETS |
|
||||
|
Tangible Assets |
87.30 |
74.79 |
77.77 |
12.24 |
12.61 |
|
Capital Work-In-Progress |
71.37 |
0.01 |
0.21 |
72.41 |
59.85 |
|
Fixed Assets |
184.08 |
102.05 |
107.22 |
189.76 |
125.54 |
|
Long Term Loans And Advances |
83.81 |
76.42 |
97.09 |
170.34 |
127.26 |
|
Total Non-Current Assets |
1,537.31 |
872.10 |
725.05 |
392.87 |
258.33 |
|
CURRENT ASSETS |
|
||||
|
Inventories |
2,343.69 |
3,966.12 |
3,923.08 |
4,727.11 |
3,726.79 |
|
Trade Receivables |
192.48 |
230.84 |
171.88 |
169.68 |
159.96 |
|
Cash And Cash Equivalents |
314.73 |
110.42 |
105.64 |
695.41 |
871.01 |
|
Short Term Loans And Advances |
1,081.85 |
719.84 |
525.79 |
831.25 |
836.42 |
|
Other Current Assets |
1,108.29 |
915.28 |
760.51 |
546.73 |
294.23 |
|
Total Current Assets |
5,584.88 |
6,308.76 |
5,853.41 |
6,970.18 |
5,888.39 |
|
Total Assets |
7,122.19 |
7,180.86 |
6,578.46 |
7,363.05 |
6,146.72 |
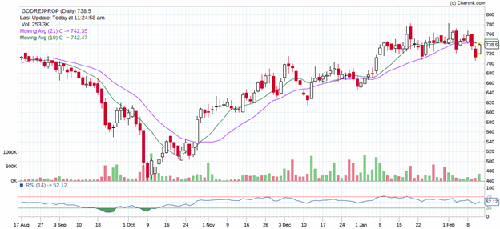
Stock Performance Chart
- Share :


Post a Comment
|
DISCLAIMER |
This report is only for the information of our customers. Recommendations, opinions, or suggestions are given with the understanding that readers acting on this information assume all risks involved. The information provided herein is not to be construed as an offer to buy or sell securities of any kind. ATS and/or its group companies do not as assume any responsibility or liability resulting from the use of such information.