Godrej Consumer Products Ltd.
Godrej Consumer Products Ltd (GCPL) was incorporated on November 29, 2000, and was promoted by Godrej & Boyce Manufacturing Company and went public in 2001. GCPL is a part of 119-year old Godrej Group and a leading Fast Moving Consumer Good (FCMG) Company that manufactures and markets Home care products, Personal Care Products, Haircare, and Air Care products such as toilet soap, detergents, hair color, household insecticide, etc. It is having manufacturing facilities at Malanpur in Madhya Pradesh, Baddi in Himachal Pradesh, Guwahati in Assam, and Namchi in Sikkim. The soap segment includes the Godrej brand and other brand toilet soaps and the personal care segment includes hair color, shaving cream and gel, talcum powder, deodorant, fairness cream, liquid detergent, and other toiletries. It also undertakes contract manufacturing of toilet soap for third parties.
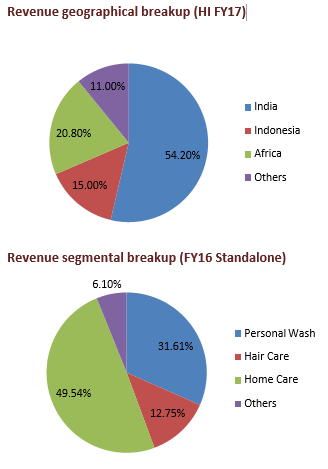
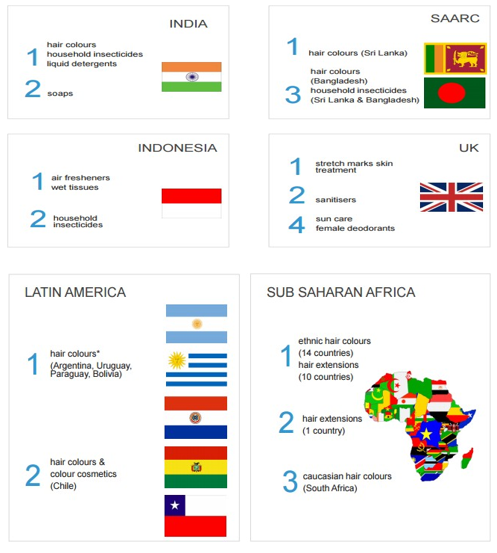
Godrej Consumer Products Ltd (GCPL) is building its presence in three emerging markets of Asia, Africa, and Latin America across three categories of home care, personal wash, and hair care. It is ranked among the largest household insecticide and hair care in emerging markets. In household insecticides, it is the leader in India, the second-largest player in Indonesia and it is expanding its footprint in Africa. Godrej Consumer Products Ltd (GCPL) is the leader in serving the hair care needs of women of African descent, the number one player in hair color in India and Sub- Saharan Africa, and among the leading player in Latin America. It stands second in terms of market share soaps in India and the number one player in air fresheners and wet tissues in Indonesia.
|
CMP (as on 23/12/2016) |
1450 |
|
52 Week H/L |
1710/1120 |
|
Market Cap (Cr) |
49271.31 |
|
Equity Capital (Rs cr) |
34.05 |
|
Face Value (Rs) |
1 |
|
|
|
|
Shareholding Pattern (%) |
|
|
Promoters |
52.50 |
|
Non Institutions |
42.50 |
|
Grand Total |
100 |
Investment Rationales:
-
Positive global growth forecast
-
Successful acquisition strategy
-
GST – a game-changer
-
Increase in shareholding in JV’s
-
Large market opportunity
|
Particulars |
FY12 |
FY13 |
FY14 |
FY15 |
FY16 |
|
Sales Turnover |
4986.61 |
6624.41 |
7822.94 |
8549.5 |
9274.03 |
|
EBITDA |
1114.32 |
1188.93 |
1231.43 |
1451.96 |
1688.3 |
|
Net Profit |
751.24 |
845.43 |
819.30 |
976.43 |
1158.89 |
|
EPS (Rs) |
22.06 |
24.83 |
24.06 |
28.68 |
34.03 |
|
PE (X) |
65.72 |
58.40 |
60.26 |
50.56 |
42.60 |
Outlook
Godrej Consumer Products Limited (GCPL) is a dominant player in personal care, health care, and home care with its high-quality products and wide market reach in both India and abroad. With the favorable demographic pattern, improvement in dynamics of consumption pattern, along available market opportunities, we expect Godrej Consumer Products Ltd (GCPL) to perform considerably well in the medium term and long term.
Company Overview
Indian product profile
|
Segment |
Brand |
|
Hare care |
Godrej Expert Crème |
|
BBLUNT |
|
|
NYU |
|
|
Personal care |
Cinthol |
|
Godrej No.1 |
|
|
Household insecticides |
Good knight |
|
Good knight Personal Repellents |
|
|
HIT |
|
|
Air fresheners and Health & Wellness |
Godrej aer |
|
Protekt |
Global brand profile
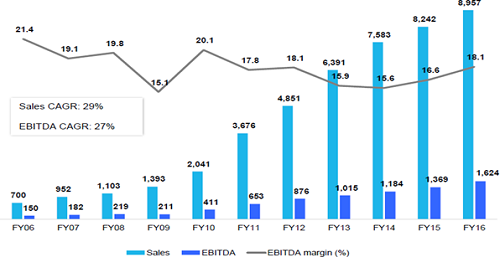
Revenue and EBITDA growth history
Market share overview
Godrej Consumer Products Ltd - Financials
Key ratios
|
|
FY12 |
FY13 |
FY14 |
FY15 |
FY16 |
|
Debt-Equity Ratio |
0.84 |
0.68 |
0.66 |
0.63 |
0.6 |
|
Long Term Debt-Equity Ratio |
0.62 |
0.53 |
0.47 |
0.45 |
0.48 |
|
Current Ratio |
1.1 |
1.24 |
1.1 |
1.08 |
1.26 |
|
Fixed Assets |
1.31 |
1.43 |
1.44 |
1.41 |
1.37 |
|
Inventory |
8.15 |
7.24 |
7.35 |
7.94 |
7.8 |
|
Debtors |
11.64 |
11.03 |
10.71 |
11.13 |
9.65 |
|
Total Asset Turnover Ratio |
1.17 |
1.23 |
1.26 |
1.26 |
1.21 |
|
Interest Cover Ratio |
11.63 |
11.03 |
9.59 |
12.1 |
14.52 |
|
EBIDTM (%) |
18.22 |
15.7 |
15.74 |
16.98 |
18.2 |
|
CPM (%) |
13.19 |
12.09 |
11.52 |
12.48 |
13.61 |
|
ROCE (%) |
19.74 |
17.82 |
18.87 |
20.57 |
21.03 |
|
RONW (%) |
25.71 |
22.58 |
22.45 |
24.15 |
24.64 |
|
Payout (%) |
21.58 |
20.82 |
22.65 |
19.93 |
17.5 |
|
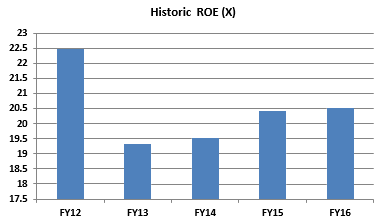
ROE (X) |
22.48 |
19.34 |
19.53 |
20.43 |
20.53 |
|
Price Earning (P/E) |
23.27 |
34.53 |
39.74 |
40.7 |
43.51 |
|
Price to Book Value ( P/BV) |
5.82 |
8 |
7.68 |
8.22 |
9.21 |
|
EV/EBIDTA |
15.76 |
23.74 |
24.9 |
25.66 |
29.09 |
|
Market Cap/Sales |
3.27 |
4 |
3.71 |
4.14 |
5.06 |
Godrej Consumer Products Limited (GCPL) has been a regular dividend payer. We believe that GCPL’s cash generation is sufficient to support common dividends. It has effectively utilized the profits retained with return on equity is in a stable condition with ROE of 22.48% in FY12 to 20.53% in FY16.
Profit and Loss account
|
|
FY12 |
FY13 |
FY14 |
FY15 |
FY16 |
|
INCOME : |
|
|
|
|
|
|
Sales Turnover |
4986.61 |
6624.41 |
7822.94 |
8549.5 |
9274.03 |
|
Excise Duty |
120.45 |
208.11 |
220.53 |
273.14 |
306.22 |
|
Net Sales |
4866.16 |
6416.3 |
7602.41 |
8276.36 |
8967.81 |
|
Other Income |
252.17 |
196.68 |
68.58 |
100.11 |
81.95 |
|
Stock Adjustments |
212.26 |
155.89 |
-50.38 |
-35.04 |
91.9 |
|
Total Income |
5330.59 |
6768.87 |
7620.61 |
8341.43 |
9141.66 |
|
EXPENDITURE : |
|
|
|
|
|
|
Raw Materials |
2527.85 |
3177.49 |
3504.3 |
3806.48 |
3937.41 |
|
Power & Fuel Cost |
79.96 |
102.56 |
103.2 |
109.92 |
109.99 |
|
Employee Cost |
401.48 |
590.68 |
742.43 |
776.95 |
959.92 |
|
Other Manufacturing Expenses |
119.92 |
167.55 |
195.85 |
223.97 |
259.32 |
|
Selling and Administration Expenses |
994.66 |
1405.16 |
1698.48 |
1818.85 |
2003.68 |
|
Miscellaneous Expenses |
92.4 |
136.5 |
144.92 |
153.3 |
183.04 |
|
Total Expenditure |
4216.27 |
5579.94 |
6389.18 |
6889.47 |
7453.36 |
|
Operating Profit |
1114.32 |
1188.93 |
1231.43 |
1451.96 |
1688.3 |
|
Interest |
72.59 |
87.32 |
119.91 |
112.46 |
109.2 |
|
Gross Profit |
1041.73 |
1101.61 |
1111.52 |
1339.5 |
1579.1 |
|
Depreciation |
64.44 |
77 |
81.85 |
90.78 |
103.11 |
|
Profit Before Tax |
977.29 |
1024.61 |
1029.67 |
1248.72 |
1475.99 |
|
Tax |
227.94 |
191.88 |
216.71 |
286.09 |
327.12 |
|
Deferred Tax |
-1.89 |
-12.7 |
-6.34 |
-13.8 |
-10.02 |
|
Net Profit |
751.24 |
845.43 |
819.3 |
976.43 |
1158.89 |
|
Minority Interest (after tax) |
24.52 |
49.33 |
59.52 |
69.35 |
39.58 |
|
Profit/Loss of Associate Company |
0 |
0 |
-0.05 |
0.04 |
0.1 |
|
NP after Minority Interest & P/L Asso.Co. |
726.72 |
796.1 |
759.73 |
907.12 |
1119.41 |
|
Extraordinary Items |
157.72 |
121.27 |
12.37 |
0.77 |
-19.33 |
|
Adjusted Net Profit |
569.00 |
674.83 |
747.36 |
906.35 |
1138.74 |
|
|
|
|
|
|
|
|
Dividend |
156.63 |
170.16 |
178.7 |
187.24 |
195.81 |
|
Preference Dividend |
0 |
0 |
0 |
0 |
0 |
|
Equity Dividend (%) |
475 |
520 |
525 |
550 |
575 |
|
Dividend Per Share(Rs) |
4.75 |
5 |
5.25 |
5.5 |
5.75 |
Balance Sheet
|
|
FY12 |
FY13 |
FY14 |
FY15 |
FY16 |
|
SOURCES OF FUNDS : |
|
|
|
|
|
|
Share Capital |
34.03 |
34.03 |
34.04 |
34.04 |
34.05 |
|
Reserves Total |
2769.94 |
3279.01 |
3741.36 |
4276.65 |
5063.63 |
|
Total Shareholders Funds |
2803.97 |
3313.04 |
3775.4 |
4310.69 |
5097.68 |
|
Minority Interest |
88.23 |
209.51 |
225.1 |
162.04 |
84.19 |
|
Secured Loans |
708.06 |
411.2 |
1591.71 |
2042.37 |
2483.38 |
|
Unsecured Loans |
1168.85 |
2045.14 |
781.71 |
674.78 |
407.74 |
|
Total Debt |
1876.91 |
2456.34 |
2373.42 |
2717.15 |
2891.12 |
|
Other Liabilities |
29.41 |
27.28 |
28.82 |
26.44 |
34.76 |
|
Total Liabilities |
4798.52 |
6006.17 |
6402.74 |
7216.32 |
8107.75 |
|
APPLICATION OF FUNDS : |
|
|
|
|
|
|
Gross Block |
4185.74 |
5065.98 |
5803.5 |
6333.09 |
7212.33 |
|
Less: Accumulated Depreciation |
493.95 |
569.92 |
682.14 |
782.14 |
901.97 |
|
Net Block |
3691.79 |
4496.06 |
5121.36 |
5550.95 |
6310.36 |
|
Capital Work in Progress |
37.58 |
140.85 |
167.07 |
224.61 |
43.66 |
|
Investments |
0 |
121.18 |
136.27 |
185.69 |
187.36 |
|
Current Assets, Loans & Advances |
|
|
|
|
|
|
Inventories |
783.91 |
1047.09 |
1082.13 |
1071.71 |
1306.98 |
|
Sundry Debtors |
472.53 |
728.76 |
732.05 |
804.58 |
1118.01 |
|
Cash and Bank |
639.87 |
747.6 |
704.79 |
894.22 |
745.87 |
|
Loans and Advances |
122.65 |
203.74 |
197.29 |
167.67 |
223.23 |
|
Total Current Assets |
2018.96 |
2727.19 |
2716.26 |
2938.18 |
3394.09 |
|
Less : Current Liabilities and Provisions |
|
|
|
|
|
|
Current Liabilities |
1147.55 |
1631.46 |
1861.46 |
1843.37 |
1978.46 |
|
Provisions |
52.06 |
57.44 |
55.89 |
65.33 |
64.82 |
|
Total Current Liabilities |
1199.61 |
1688.9 |
1917.35 |
1908.7 |
2043.28 |
|
Net Current Assets |
819.35 |
1038.29 |
798.91 |
1029.48 |
1350.81 |
|
Deferred Tax Assets |
18.3 |
34.88 |
46.09 |
57.18 |
74.39 |
|
Deferred Tax Liability |
17.79 |
20.86 |
25.77 |
25.97 |
33.13 |
|
Net Deferred Tax |
0.51 |
14.02 |
20.32 |
31.21 |
41.26 |
|
Other Assets |
249.29 |
195.77 |
158.81 |
194.38 |
174.3 |
|
Total Assets |
4798.52 |
6006.17 |
6402.74 |
7216.32 |
8107.75 |
Industry Overview
The Indian FMCG market is valued at about US$ 185 billion or about Rs 12.4 trillion. It has grown annually at about 12% per annum over the past decade. The key segments within this sector are staples, packaged food, beverages, consumer health, and home & personal care. The staples segment has a share of about 70% of the total market, with it being fairly divided between its sub-segments namely pulses & cereals, edible oils & fats and dairy. The share of the branded players in these set of products is fairly low. However, when it comes to segments such as packaged foods, beverages, consumer health and home & personal care (all of which have a combined size of 30% of the market), the branded players have majority share. On an overall basis, the share of the branded segment stands at about a third.
Indian consumer segment is broadly segregated into urban and rural markets, and is attracting marketers from across the world. The sector comprises of a huge middle class, relatively large affluent class and a small economically disadvantaged class, with spending anticipated to more than double by 2025.
2015 did not witness the anticipated revival of demand in the consumer goods sector in India. A weak monsoon led to a slowdown in rural demand, especially in the second quarter of 2015, which in turn impacted revenue growth of packaged consumer goods companies in India since they depend on the rural market for around 35% of their sales. However, the overall consumer sentiment remains positive. India continued to be on top of researcher Nielsen’s global consumer confidence index in the third quarter of 2015, rising for the eighth straight quarter. Consumer demand in urban areas is slowly picking up, indicating a revival of the Indian economy.
India's organized FMCG space is expected to grow at a pace of 14% YoY per annum for the next decade to the size of US$ 220 billion to 240 billion. Consumption is expected to be driven by factors such as increasing income, rising urbanisation, nuclearisation, as well as growing work force. As per BCG report, incomes are likely to rise by 70% by 2025; more than a third of the population is likely to reside in urban parts of the country; reducing household sizes due to nuclearisation is likely to add about 10 million households by 2020; about a 100 million people are expected to join the work force by 2020.
The Government of India has allowed 100 per cent Foreign Direct Investment (FDI) in online retail of goods and services through the automatic route, thereby providing clarity on the existing businesses of e-commerce companies operating in India.
India’s personal care industry is composed of hair care, bath products, skin care and cosmetics, and oral care. The sector is driven by rising income, rapid urbanization and celebrity promotions. This industry accounts for 22% of the country’s fast-moving consumer goods (FMCG), which is the term for Consumer Packaged Goods in India. Foreign direct investment in this sector totaled $691 million in 2014. Hair care is a main category of this industry. A study by Nielsen determined that shampoo is the most popular FMCG product in India. The consumption pattern of cosmetics among teenagers went up substantially between 2005 and 2015 because of increasing awareness and desire to look good. In fact, this product category is among the fastest growing segments for the manufacturers of a range of products including body sprays. Over 68 percent of young adults feel that using grooming products boost their confidence.
Estimated at $1 billion, the soap and bath category is significant. Soap is a prevalent product found in more than 90% of Indian households. The most common brands include Godrej’s Cinthol, Reckitt Benckiser’s Dettol, Wipro’s Santoor, and Unilever’s Lux, Dove, Hamam, and Lifebuoy. The market is mainly driven by the bath soap category, whereas the body wash and shower gel is the fast expanding category in India. Also, the demand for liquid hand wash is progressively rising among Indian consumers. Bath soaps are traditionally used among Indian consumers for personal wash, which itself has a big market in India with huge penetration and strong competition. Indian consumers still prefer bath soaps where they have numerous options to choose their product according to their requirements. Herbal soap is the fastest-growing category in the Indian soap market. Moreover, the premium and super-premium soaps are gaining momentum among Indian urban consumers, whereas, mass and popular soaps are top-selling products in the rural market. Thus, the soap market enjoys the positive response of rural as well as urban consumers in India.
The Indian household insecticide market has been growing with a CAGR of 5% from the last five years and is projected to more than double by the year 2021 due to a rising incidence of vector-borne disease in India, growing awareness regarding prevention of home insects, brand awareness, increasing disposable income, growing demand in middle-class people and affordable price of home insecticide products. The various formats, such as coils, mats, liquid vaporizers, sprays, gel, powder, patches, baits, etc., are driving the segmental market of the household insecticide market in India. Household insecticide has become a gripping market for new product developments and innovation, where producers are trying to convince consumers through aggressive campaigns and advertising that they should adopt home insecticide products to improve home hygiene and to be protected from mosquito-borne disease, the infection caused from cockroaches and other insects. A multipurpose home insecticide product is an emerging trend in the industry. However, the penetration of home insecticide products is low, especially in rural India, but this offers enormous opportunities to the Indian household insecticide industry.
Peer group comparison
|
Co_Name |
Gross Sales |
PBIDT |
PAT |
PBIDTM (%) |
P/E |
P/BV |
EV/EBIDTA |
|
Hind. Unilever |
35637.45 |
6308.38 |
4054.05 |
17.7 |
55.56 |
47.38 |
29.39 |
|
Dabur India |
8543.13 |
1739.01 |
1233.2 |
20.36 |
34.99 |
10.53 |
25.53 |
|
Emami |
2662.99 |
726.18 |
406 |
29.4 |
64.68 |
15.06 |
29.87 |
|
Marico |
6139.17 |
1155.85 |
708.69 |
18.83 |
47.55 |
14.92 |
27.09 |
|
Jyothy Lab. |
1705.74 |
234.69 |
150.37 |
13.76 |
37.61 |
6.2 |
24.01 |
|
Godrej Consumer |
9274.03 |
1688.3 |
1138.74 |
18.2 |
43.51 |
9.21 |
29.09 |
Investment rationales
Positive global growth forecast
Economic growth in India gained momentum in the second quarter of the fiscal year 2016, but dynamics remained lopsided. GDP increased 7.3% annually in the July to September period, which came in above the 7.1% rise recorded in the first quarter. The International Monetary Fund (IMF) and the Moody’s Investors Service have forecasted that India will witness a GDP growth rate of 7.5 percent in 2016, due to improved investor confidence, lower food prices, and better policy reforms. Besides, according to the World Bank, the Indian economy will likely grow at 7.6 percent in 2016-17, followed by a further acceleration to 7.7 percent in 2017-18 and 7 percent in 2020. This growth is mainly driven by an increase in manufacturing activities, a rising working women population, and a fast-growing middle class. India’s growing middle class, which is estimated at around 70 million people or ~5.5% of the population, is much smaller and it is expected to grow steadily over the next decade, reaching 200 million by 2020.
Between the years 1965 and 1997 the Indonesian economy grew at an average annual rate of almost seven percent. This achievement enabled Indonesia to graduate from the ranks of “low-income countries” into that of the “lower-middle-income countries”. Indonesia's GDP per capita has risen rapidly over the past decade although it has weakened over the past two years amid the economic slowdown. GDP per capita in Indonesia is expected to be 3940.50 USD by the end of this quarter. In the long-term, the Indonesia GDP per capita is projected to trend around 4311.35 USD in 2020.
Africa’s economic performance held firm in 2015, amid global headwinds and regional shocks. Growth in real GDP is estimated at 3.6%, higher than the 3.1% for the global economy and 1.5% for the euro area. Africa remained the world’s second fastest-growing economy after East Asia. In 2015, sub-Saharan Africa (excluding South Africa) grew faster than the continental average, at 4.2%, with East Africa leading the way at 6.3%. Growth in Central, North, and West Africa was above 3%, while Southern Africa grew by an average of 2.2%. Looking ahead, average growth in Africa is expected to remain moderate at 3.7% in 2016 but could accelerate to 4.5% in 2017.
With the increase in GDP, per capita income, and change in consumption pattern on geographies that GCPL operates in, it is excepted to have a positive impact on the company due to the large product portfolio to cater the need of product demand from different geographies.
Successful acquisition strategy
Godrej Consumer Products Ltd (GCPL) has acquired companies in focused geographies and categories at reasonable valuations. The acquired companies are given significant autonomy to maintain their distinct culture while ensuring that the best practices of the group are followed. Exchange of learning’s across geographies accelerates growth and mitigates risk. Moreover, GCPL uses its technological and marketing expertise in one business unit to grow organically in another business unit in another region. Household Insecticides in Africa and the upcoming hair care launch in Indonesia are examples of this growth via cross-pollination. Following are the recent acquisitions:
-
Godrej Consumer Products Limited (GCPL) has bought out foreign companies such as Keyline Brands Limited (United Kingdom) in 2005, Rapidol (Pty) Limited in 2006, and Godrej Global Mid East FZE in 2007 and the joint venture with SCA Hygiene Products AB, Sweden in 2007.
-
Godrej Consumer Products Ltd (GCPL) owned a 49% non-controlling share in Godrej Sara Lee Limited (GSLL), an unlisted joint venture between the Godrej Group and Sara Lee Corporation USA which produces frozen and packaged food, as of early 2010. In May 2010, it acquired Sara Lee's 51% controlling share.
-
In 2010, Godrej made several acquisitions, including Indonesian firm Megasari and Tura. In addition, Godrej entered Latin America with the acquisition of Issue Group and Argencos in Argentina, and later acquired Cosmética Nacional, a Chilean company.
-
In 2015, Godrej announced it had fully acquired a 100% equity stake in South African hair extensions firm Frika Hair.
-
In 2011, GCPL had acquired a 51 percent stake in the Ghana-based Darling Group, market leader in hair extension products. It fully bought out the company later in 2014.
-
Its other recent acquisitions in Africa include Frika in South Africa (2015) and Canon Chemicals in Kenya (2016).
-
Acquired Strength of Nature LLC (SON), a US-based company that makes hair care products targeted at women of African descent.
-
Kenyan firm Charm Industries as its wholly-owned subsidiary by acquiring the rest 49 per cent share for an undisclosed amount on December 2016.
GST – a game changer
The implementation of the Goods and Services Tax (GST) is expected to benefit the GCPL immensely by reducing the overall incidence of taxation. GST aims to reduce the cascading effect by replacing a multitude of indirect taxes such as central excise, service tax, VAT and inter-state sales tax with a single GST rate. The implementation of GST is expected to provide a level playing field to all firms in the sector in India, with easier movement of goods across states and enhanced operational efficiencies, rather than tax considerations, determining the location and movement of goods. It will fundamentally change the way packaged consumer goods businesses have been operating, and result in significant changes, especially in warehousing, transport and logistics. As a result of the provisions of the GST bill, companies in the sector are expected to gain from lower logistics costs, and save up to 1.5% of sales in warehousing costs. These benefits are expected to be passed on to the consumer thereby boosting demand. GST is expected to result in easier movement of goods and lower operation costs, an outcome that can help smaller packaged consumer goods companies expand their footprint based on reduction in business costs instead of focusing solely on taxation.
Increase in shareholding in JV’s
GCPL will increase shareholding in many of its joint ventures as part of its consolidation process, besides keeping acquisitions open in markets where it is already present. It is increasing the shareholding in many joint ventures based on put and call options in the original agreements. GCPL has two joint ventures - one with the Darling Group in Africa and another with Canon Chemicals Ltd, a Kenya based home and personal care company. GCPL entered into an agreement with Canon Chemicals Ltd, which manufactures and distributes products in the personal and home care categories, for an acquisition of 75 per cent stake in its business in Kenya. After entering into a JV with the Darling Group in 2011, GCPL has since then acquired 100 per cent stake in the Nigeria and Ghana businesses, 90 per cent stake in South Africa and Mozambique businesses and 51 per cent stake in the Kenya business. GCPL has a strong history of acquisitions in global markets. These include buying of Nigeria's Tura soap brand, Indonesia's household care firm Megasari Group, Argentinian hair care firm Argencos and Issue Group, a market leader in hair colour in Argentina, Peru, Uruguay and Paraguay, among others. The increase in share holding in JV’s shows the potential opportunity of the business in the region and is excepted to create more value and reach for the company.
Large market opportunity
GCPL has a 3×3 matrix and over 90% of its turnover conforms to this strategy. The strategy dictates that GCPL will operate in three geographies (Asia, Africa, and Latin America) and in three product categories (home care, hair care, and personal care). Moreover, GCPL occupies either a number one or number two position in most of the segments in which company operates. The market share of GCPL in these markets are less than 10% of the overall market opportunity, this provides amble penetration opportunity to the company mainly because of large product innovation base and quality of the product.
Sound financials
The top line of the company has grown at a compounded annual growth rate of 13.2% in last 5 years on consolidated basis, the cost of raw materials are growing at a relatively slow CAGR at of 9.3% and net profit of growing a fast paced CAGR of 14.9%. EBDIT margin stands at 21.30% and ROCE at 21.03% in FY16. With the excepted pick-up in demand in all geographies it operates in, along with the stable raw material prices we except the financials of the company to become more healthier.
Conclusion and Recommendation
GCPL is a dominant player in consumer goods segment with wide market reach and diverse product portfolio. Along with increase in per capita income in India and abroad, change in consumption pattern, implementation of GST and its successful acquisitions, we expect company to outperform the industry in the both medium term and long term.
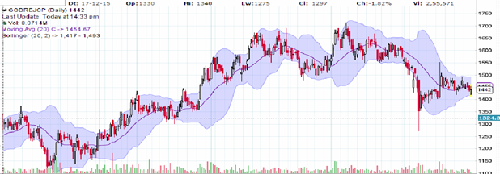
One Year stock performance
- Share :


Post a Comment
|
DISCLAIMER |
This report is only for the information of our customers. Recommendations, opinions, or suggestions are given with the understanding that readers acting on this information assume all risks involved. The information provided herein is not to be construed as an offer to buy or sell securities of any kind. ATS and/or its group companies do not as assume any responsibility or liability resulting from the use of such information.