TRIVENI ENGINEERING AND INDUSTRIES LIMITED REPORT RESEARCH
Market Price: ₹279 Recommendation: BUY Target: ₹465 Time Horizon: 1 Year
Q4FY2023 REVIEW
Triveni Engineering & Industries Limited reported net revenue of ₹1818.29 crores for the quarter ended March 31, 2023, compared to ₹1192.12 crores for March 31, 2022. Profit After Tax was ₹190.31 crores for the quarter ended March 31, 2023, compared to ₹109.17 crores during the corresponding quarter of the previous year, respectively.
OVERVIEW
- The firm is seeing strong market demand from clients in both the product and aftermarket categories, particularly since it has been pursuing the high-speed high-power segment independently.
- FY 23 order booking and closing order book growth is driven by both of these market segments. Outstanding orders as of March 31, 2023, were 260.42 crore, including 126.98 crore in long-term orders.
BENCHMARK COMPARISON
Beta: 0.99 |
Alpha: 55.22 |
Risk Reward Ratio: 2.32 |
Margin of Safety: 38% |
STOCK DATA
|
52 Week H/L |
311.4/217.60 |
|
Market Cap (crores) |
6,120 |
|
Face Value (₹) |
1.00 |
|
Book Value |
121.76 |
|
EPS TTM |
74.58 |
|
NSE Code |
TRIVENI |
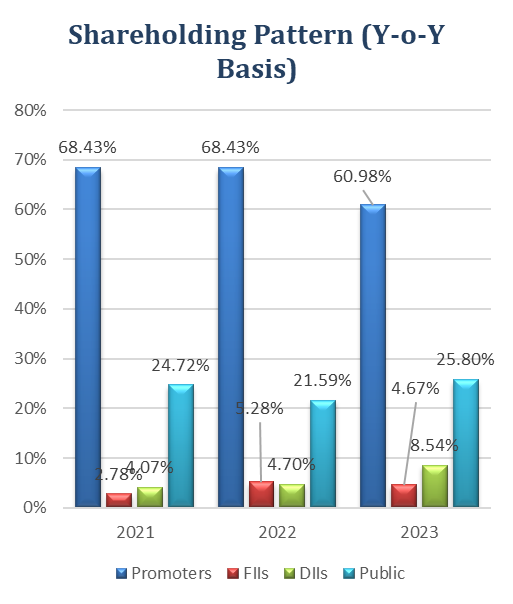
SHAREHOLDING PATTERN (%)
|
|
Sep-22 |
Dec-22 |
Mar-23 |
|
Promoter |
68.25 |
61.22 |
60.98 |
|
Public |
21.28 |
25.40 |
25.80 |
|
FIIs |
4.43 |
5.29 |
4.67 |
|
DIIs |
6.02 |
8.10 |
8.54 |
BUSINESS
- An Indian conglomerate called Triveni Engineering & Industries Limited (TEIL) is involved in the sugar, alcohol, power transmission, water & wastewater treatment, and military industries. Kanpur, Uttar Pradesh, serves as the company's headquarters. It was established in 1964.
- Here is a more thorough breakdown of TEIL's business divisions.
- Sugar: One of India's largest integrated sugar manufacturers, TEIL, has a crushing capacity of more than 10 million tonnes annually. 13 sugar mills owned by the firm are spread throughout Uttar Pradesh, Bihar, Madhya Pradesh, and Jharkhand. A captive power plant with a 200 MW capacity is also owned by TEIL.
- Alcohol: TEIL, which has an annual capacity of 1.5 million litres, is a major producer of alcohol in India. Drinks, medicines, and cosmetics are just a few of the businesses that employ the company's alcohol.
- Power transmission: In India, TEIL is a major player in the transmission of power industry. The firm produces a variety of insulators, gearbox towers, and other associated machinery. Power utilities, developers, and EPC contractors all throughout India employ TEIL's products.
- Treatment of water and wastewater: In India, TEIL is a top supplier of water and wastewater treatment systems. The business provides a wide range of goods and services, such as desalination, wastewater, and water treatment plants. Numerous sectors, including desalination, municipal water & wastewater treatment, and industrial water & wastewater treatment, utilise TEIL's solutions.
- Defence: In India, TEIL is a major provider of defence goods. The firm produces a broad variety of goods, such as artillery weapons, ammunition, and other ancillary machinery. The Indian Armed Forces and other military organisations employ TEIL's goods.
- Business Segments:
- Sugar & allied businesses- (89% of revenue in FY23 vs 88% in FY22) comprises the manufacture of sugar and distillation of alcohol.
- Engineering business- (11% of revenue in FY23 vs 12% in FY22) comprises the manufacture of high-speed gears, gearboxes and providing water/waste-water treatment solutions.
SWOT ANALYSIS
STRENGTH
- Strong track record of growth and profitability.
- Well-diversified business portfolio.
- Strong financial position.
- Strong brand name and reputation.
WEAKNESS
- Limited international presence.
- Reliance on a key customer.
- Exposure to Cyclical Industries
OPPORTUNITIES
- Partnership with strategic allies.
- Expansion in new markets.
- Development of new products and services.
THREAT
- Changes in government policies.
- Competition from new entrants.
SUGAR INDUSTRY ANALYSIS
- Sugar Industry Overview:
- After Brazil, India is the second-largest producer of sugarcane worldwide. India increased its sugarcane production from 379.7 million tonnes to 385.7 million tonnes in the crop year 2022–2023. Favourable weather and a larger area under cultivation were the causes of the rise in production.
- India's top three sugarcane-producing states are Uttar Pradesh, Maharashtra, and Bihar. The largest producer in the nation, Uttar Pradesh accounts for nearly 40% of all output. With roughly 20% of the nation's overall production, Maharashtra is the second-largest producer. With nearly 10% of the nation's overall production, Bihar ranks third among producers.
- In India, sugar is mostly produced from sugarcane. The nation produces roughly 26 million tonnes of sugar annually, or 10% of the total amount produced worldwide. Ethanol, a biofuel that may be used in automobiles, is also made from sugarcane.
- By 2025, the Indian government hopes to produce 400 million tonnes of sugarcane. The government intends to accomplish this goal by expanding the area under cultivation, enhancing sugarcane yield, and encouraging the use of biofuels derived from sugarcane.
Ethanol Outlook:
- To meet the anticipated increase in demand in 2025 when it expects to introduce 20% ethanol-blended petrol across the nation, India is actively encouraging the construction of both traditional and second-generation (2G) ethanol plants.
- The Indian government began selling 20% ethanol-blended petrol in February, two months before the scheduled launch date of 1 April. They plan to make it available nationwide by the financial year 2025–26.
- By the end of the year 2023, the government projects a 25% increase in the nation's overall ethanol production capacity.
- Sugarcane is used to produce nearly 70% of the current capacity, while grains like rice and maize contribute the remaining 30%.
- India now has the potential to manufacture 9.5 billion liters of ethanol annually, of which 6.2 billion liters are made from sugarcane and 3.3 billion liters from grain, according to official government figures.
- The government is also aggressively supporting the construction of 2G ethanol facilities to significantly enhance output.
FINANCIAL OVERVIEW
QUARTERLY SUMMARY
|
Quarterly (INR in lakhs) |
Mar-23 |
Dec-22 |
Sep-22 |
Jun-22 |
Mar-22 |
|
Revenue from Operations |
1,81,829 |
1,65,871 |
1,47,162 |
1,36,148 |
1,19,212 |
|
Other income |
2,157 |
3,727 |
1,171 |
986 |
296 |
|
Total Income |
1,83,986 |
1,69,598 |
1,48,333 |
1,37,134 |
1,19,508 |
|
|
|
|
|
|
|
|
Total Expenditure |
1,57,949 |
1,48,914 |
1,44,965 |
1,26,938 |
1,03,768 |
|
EBIT |
26,037 |
20,684 |
3,368 |
10,196 |
15,740 |
|
|
|
|
|
|
|
|
Finance cost |
980 |
813 |
1,716 |
2,165 |
1,461 |
|
Profit/(loss) before share of profit/(loss) of associates |
25,057 |
19,871 |
1,652 |
8,031 |
14,279 |
|
|
|
|
|
|
|
|
share of profit/(loss) of associates |
- |
- |
796 |
837 |
733 |
|
PBT Before Exceptional Items |
25,057 |
19,871 |
2,448 |
8,868 |
15,012 |
|
|
|
|
|
|
|
|
Exceptional Items |
- |
- |
1,40,120 |
- |
-671 |
|
PBT |
25,057 |
19,871 |
1,42,568 |
8,868 |
14,341 |
|
|
|
|
|
|
|
|
Tax Expenses |
6,026 |
5,143 |
3,792 |
2,223 |
3,424 |
|
PAT |
19,031 |
14,728 |
1,38,776 |
6,645 |
10,917 |
PROFIT AND LOSS STATEMENT (₹ in lakhs)
|
|
Mar-21 |
Mar-22 |
Mar-23 |
|
Revenue from Operations |
4,70,335 |
4,69,404 |
6,31,010 |
|
Other Income |
3,040 |
2,219 |
8,041 |
|
Total Income |
4,73,375 |
4,71,623 |
6,39,051 |
|
|
|
|
|
|
Cost of Goods sold |
3,43,607 |
2,85,917 |
4,08,649 |
|
Gross Profit |
1,29,768 |
1,85,706 |
2,30,402 |
|
|
|
|
|
|
Excise Duty |
2,918 |
40,310 |
69,326 |
|
Employee Benefits Expense |
27,077 |
30,265 |
34,828 |
|
Other Expenses |
40,573 |
49,472 |
56,615 |
|
EBITDA |
59,201 |
65,659 |
69,633 |
|
|
|
|
|
|
Depreciation and Amortisation Expense |
8,249 |
8,074 |
9,348 |
|
EBIT |
50,952 |
57,585 |
60,285 |
|
|
|
|
|
|
Finance Costs |
5,163 |
5,453 |
5,674 |
|
EBT before Share of Profit/(Loss) of Joint Venture and Associates |
45,789 |
52,132 |
54,611 |
|
|
|
|
|
|
Share of Profit/(Loss) of Joint Venture and Associates |
121 |
5,914 |
1,633 |
|
EBT before Exceptional Items |
45,910 |
58,046 |
56,244 |
|
|
|
|
|
|
Exceptional Items |
-67 |
-671 |
1,40,120 |
|
EBT |
45,977 |
57,375 |
1,96,364 |
|
|
|
|
|
|
Tax Expense |
16,516 |
14,969 |
17,184 |
|
PAT Non-Controlling Interests |
29,460 |
42,406 |
1,79,180 |
|
|
|
|
|
|
Non-Controlling Interests |
- |
- |
- |
|
PAT |
29,460 |
42,406 |
1,79,180 |
|
|
|
|
|
|
EPS |
|
|
|
|
Basic |
12 |
18 |
75 |
|
Diluted |
12 |
18 |
75 |
|
|
|
|
|
|
Number of Shares |
|
|
|
|
Basic |
2,453 |
2,418 |
2,403 |
|
Diluted |
2,453 |
2,418 |
2,403 |
Balance Sheet (₹ in lakhs)
|
|
Mar-21 |
Mar-22 |
Mar-23 |
|
ASSETS: |
|
|
|
|
Non-Current Assets: |
|
|
|
|
Property, Plant and Equipment |
1,05,898 |
1,06,308 |
1,45,441 |
|
Capital Work-in-Progress |
2,223 |
25,653 |
2,831 |
|
Investment Property |
1,210 |
1,210 |
1,210 |
|
Other Intangible Assets |
124 |
68 |
68 |
|
Intangible Assets Under Development |
- |
3 |
- |
|
Finance Assets: |
|
|
|
|
Investments |
658 |
635 |
616 |
|
Trade Receivables |
11,982 |
16,469 |
17,109 |
|
Loans |
2 |
2 |
3 |
|
Other Financial Assets |
1,397 |
1,646 |
1,538 |
|
Total Non-Current Assets |
1,40,732 |
1,73,983 |
1,71,247 |
|
|
|
|
|
|
Current Assets: |
|
|
|
|
Inventories |
1,73,375 |
2,03,687 |
1,99,649 |
|
Financial Assets: |
|
|
|
|
Trade Receivables |
20,839 |
26,680 |
39,197 |
|
Cash and Cash Equivalents |
1,128 |
2,328 |
7,201 |
|
Other Bank Balances |
132 |
462 |
754 |
|
Other Financial Assets |
259 |
650 |
1,726 |
|
Other Current Assets |
23,027 |
21,912 |
25,612 |
|
Total Current Assets |
2,21,264 |
2,55,765 |
2,74,197 |
|
|
|
|
|
|
Total Assets |
3,61,995 |
4,29,748 |
4,45,444 |
|
|
|
|
|
|
EQUITY AND LIABILITIES: |
|
|
|
|
Equity: |
|
|
|
|
Equity Share Capital |
2,418 |
2,418 |
2,189 |
|
Other Equity |
1,53,150 |
1,88,867 |
2,64,336 |
|
Total Equity |
1,55,567 |
1,91,285 |
2,66,525 |
|
|
|
|
|
|
Liabilities: |
|
|
|
|
Non-Current Liabilities: |
|
|
|
|
Financial Liabilities |
|
|
|
|
Borrowings |
30,891 |
31,918 |
22,240 |
|
Lease Liabilities |
973 |
977 |
1,228 |
|
Provisions |
5,175 |
13,542 |
10,872 |
|
Deferred Tax Liabilities |
13,409 |
509 |
3,394 |
|
Total Non-Current Liabilities |
51,519 |
50,297 |
39,953 |
|
|
|
|
|
|
Current Liabilities: |
|
|
|
|
Financial Liabilities: |
|
|
|
|
Borrowings |
66,831 |
1,24,058 |
68,890 |
|
Lease Liabilities |
353 |
554 |
569 |
|
Trade Payables: |
|
|
|
|
Total Outstanding Dues of Micro and Small Enterprises |
539 |
798 |
862 |
|
Other Creditors |
61,891 |
34,286 |
40,606 |
|
Other Financial Liabilities |
4,735 |
8,005 |
7,562 |
|
Other Current Liabilities |
14,920 |
14,313 |
15,948 |
|
Provisions |
3,728 |
4,829 |
4,429 |
|
Current Tax Liabilities |
1,912 |
1,323 |
100 |
|
Total Current Liabilities |
1,54,909 |
1,88,166 |
1,38,966 |
|
|
|
|
|
|
Total Equity & Liabilities |
3,61,995 |
4,29,748 |
4,45,444 |
Cash Flow Statement (₹ in lakhs)
|
|
Mar-21 |
Mar-22 |
Mar-23 |
|
Net Profit Before Tax |
45,977 |
57,375 |
1,96,364 |
|
Net Cash from Operating Activities |
79,083 |
-17,339 |
39,744 |
|
Net Cash Used for Investing Activities |
-10,786 |
-25,675 |
1,41,365 |
|
Net Cash From (Used For) Financing Activities |
-70,373 |
44,214 |
-1,76,236 |
|
Net Increase in Cash and Cash Equivalents |
-2,076 |
1,200 |
4,873 |
|
Cash And Cash Equivalents at The Beginning of The Year |
3,204 |
1,128 |
2,328 |
|
Cash And Cash Equivalents at The End of the Year |
1,128 |
2,328 |
7,201 |
Ratio Analysis
|
|
Mar-21 |
Mar-22 |
Mar-23 |
|
Profitability Ratio |
|
|
|
|
Gross Profit |
27.59% |
39.56% |
36.51% |
|
EBITDA Margin |
12.59% |
13.99% |
11.04% |
|
EBIT Margin |
10.83% |
12.27% |
9.55% |
|
Pre-Tax Margin |
9.78% |
12.22% |
31.12% |
|
Net Profit Margin |
6.26% |
9.03% |
28.40% |
|
|
|
|
|
|
Return on Investment |
|
|
|
|
Return on Asset – ROA |
8% |
11% |
41% |
|
Return on Capital Employed – ROCE |
25% |
26% |
22% |
|
Return on Equity – ROE |
20% |
24% |
25% |
|
|
|
|
|
|
Liquidity Ratio (x) |
|
|
|
|
Current ratio |
1.43 |
1.36 |
1.97 |
|
Quick Ratio |
0.31 |
0.28 |
0.54 |
|
|
|
|
|
|
Solvency Ratio |
|
|
|
|
Debt to Equity |
0.20 |
0.17 |
0.08 |
|
Interest Coverage Ratio |
10 |
11 |
11 |
Technical Analysis
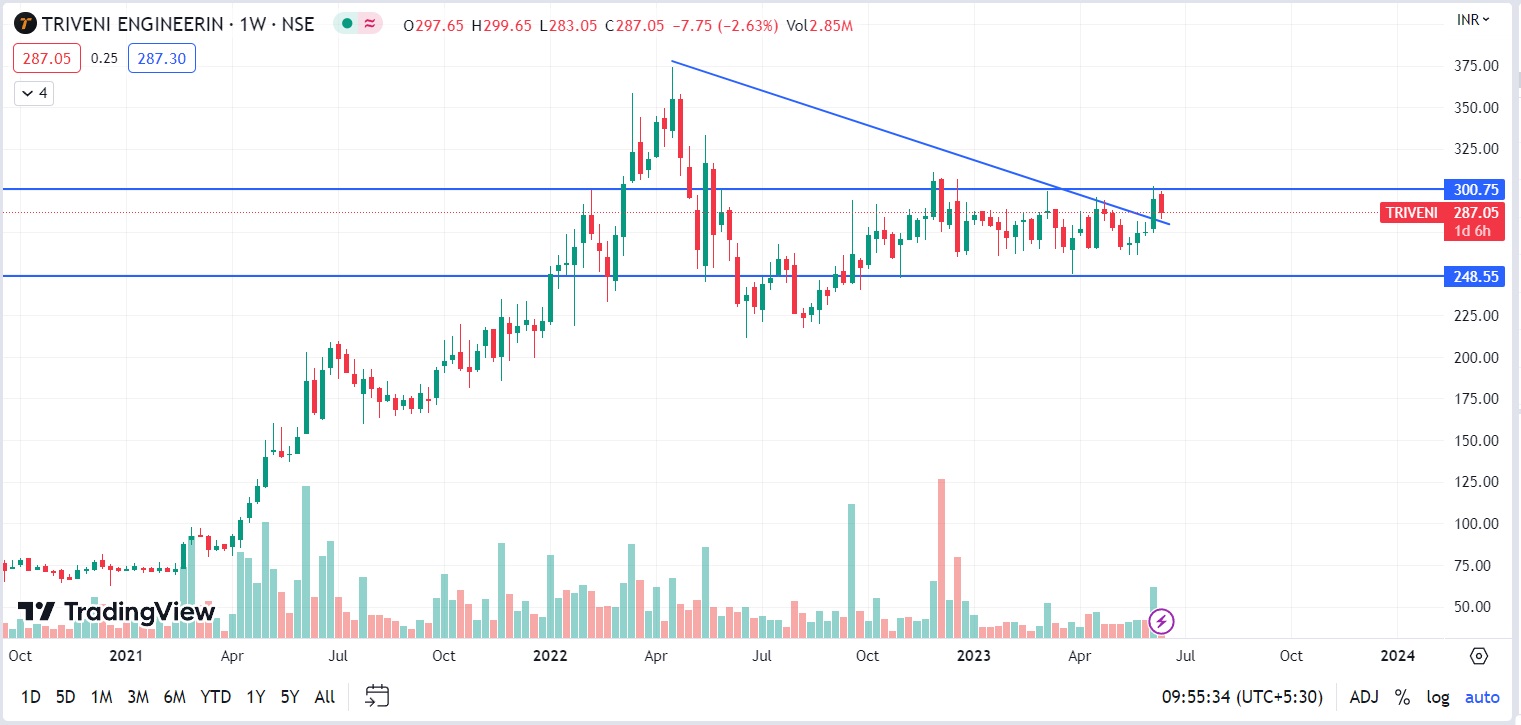
- Stock is in upward trend on monthly and weekly charts, ₹248 and ₹300 are support and resistance levels
- One can accumulate this stock at current levels.
CONCALL (Q4FY2023)
- Achieving multiple milestones, including the highest-ever crush in the sugar season of 2022–2023, record gross and net turnover, and considerable development in the engineering and alcohol industries, Triveni Engineering & Industries Limited reported good financial results for Q4 and FY23. Additionally, the business sold all of its stock in Triveni Turbine Limited, generating a payout to stockholders of Rs. 800 crore.
- For FY23, the business has suggested a final dividend of $3.25 per share.
- Six out of seven sugar units reported their highest-ever crush rates, giving the sugar industry its highest-ever sugarcane crush. Additionally, the business generated the largest amount of medicinal quality sugar ever and made a sizable profit from sugar exports on an independent basis, the company's overall debt has greatly decreased.
- An extra 85 crore in capital expenditures has been approved by the firm for the sugar industry. Triveni's sugarcane fields are situated along well-connected canal networks, which lessens the possibility that farmers may be adversely affected by bad weather. For the 2022–2023 season, India is expected to produce 32.8 million tonnes of sugar, which will be enough to fulfill local needs, the needs of the ethanol blending programme, and export market demand.
- Triveni has made the strategic choice to increase its capacity and provide many feed options for the manufacture of ethanol, giving it the freedom to choose based on the relative cost of each raw material. A total of 305 crores in CapEx have been approved by Triveni for the Sugar Business Group, with the majority of the 175 crores from the past two Board meetings taking place this year and around 30% to 35% in the next year.
- With ethanol accounting for the majority of sales, Triveni's alcohol division saw the greatest level of production and increased realisation. The Milak Narayanpur distillery is producing alcohol at a successful rate, and the alcohol industry is increasing its distillation capacity and effectively managing its ethanol sales strategy. In Q4 of the current fiscal year, the business plans to sequentially commission the Rani Nangal and Sabitgarh distilleries. Triveni is building two distilleries for the alcohol industry at a cost of 460 crore, with most of the cost being expended this year.
- Triveni expects that the state government would shift towards a higher-quality product, such as grain-based ENA, which will free up molasses for ethanol production. The total liquor industry in Uttar Pradesh is expanding at a rapid rate. Although the nation's ability to produce ethanol is now below the 20% mark, additional distilleries are anticipated to open by 2025 or 2026.
- In FY 24, they plan to produce more than 21 crore litres of ethanol, and between 28 and 32 crore litres in FY 25.
Recommendation Rationale
- One of India's biggest sugar producers with effective operations
- With a 61,000 TCD capacity, TEIL is one of the biggest sugar producers in the nation and continues to have one of the greatest recovery rates in UP. Due to poor agro-climatic circumstances, the recovery rate significantly decreased to 11.46% in FY2023 (PY: 11.78%). In FY2022 (PY: 11.55), the net recovery rate decreased to 10.23% as a result of increased cane diversion to B-heavy molasses.
- The net recovery rates may be moderated in the near term by a larger divergence towards ethanol, but this effect is anticipated to be mitigated by the increasing contribution from the distillery division with a favourable feedstock composition.
- Operations and engineering businesses that are forward-integrated protect the sugar industry against cyclicality:
- With a distillery capacity of 660 KLPD and a cogeneration capacity of 104.5 MW, TEIL's activities are forward-integrated and offer protection against the sugar industry's cyclicality as well as alternate income sources. By raising its distillery capacity to 885 KLPD by the fourth quarter of FY2024 from 660 KLPD, the business will boost its operational profile.
- Revenue for Triveni Engineering & Industries (TEIL) increased by 52.5% year over year to Rs. 1,818.3 crore in Q4FY2023, driven by 2.1x year over year growth in the distillery business to Rs. 591.8 crore, 38% year over year growth in the sugar business to Rs. 1,170.9 crore, and 12% year over year growth in the engineering business to Rs. 188 crore. Due to a shift in mix, gross margins dropped 674 basis points year over year to 29.4%, while EBITDA margins remained constant at 14.5%. With higher other income and improved EBIT margins, the adjusted PAT increased by 74.3% year over year to Rs. 190.3 crore. Revenue increased by 34.4% year over year to Rs. 6,310.1 crore for FY2023, driven by solid performance across businesses.
- Strong capital structure and healthy coverage metrics:
- As of March 31, 2023, TEIL's total debt decreased from Rs. 1,568 crore on March 31, 2022, to Rs. 913 crore. A capex of Rs. 85 crore has been approved by the Board for the sugar industry.
- Better coverage indicators in FY2023, as a result of a sound capital structure and increased operating profitability. Moving forward, favourable cash accruals are anticipated to keep the credit metrics strong throughout the medium term.
Valuation
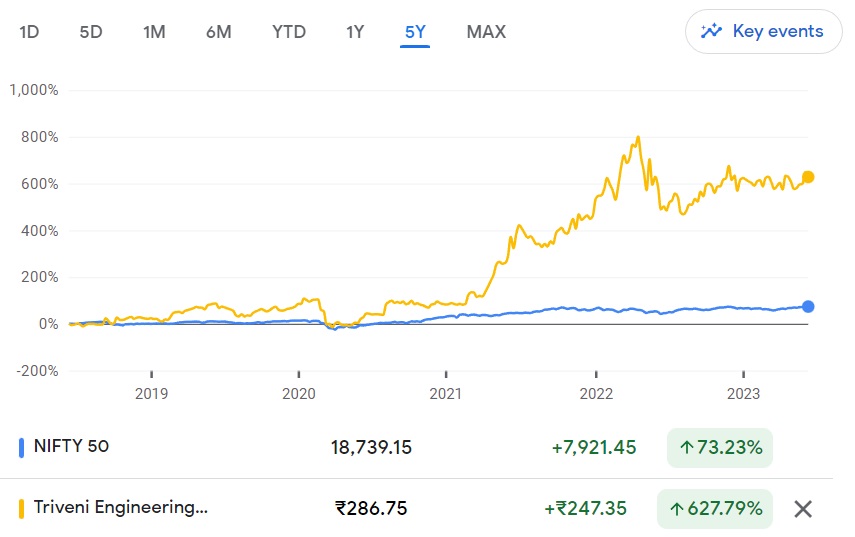
- Triveni Engineering & Industries Limited has shown revenue growth of 18.35% CAGR for FY2019-2023.
- Net Profit has shown a growth rate of 27% CAGR for FY2019-2023.
- The company’s ROE and ROCE are 25% & 22% for FY2023.
- We estimate the company could generate higher revenue and net profit for the following FY 2024, comparable to the prior year, based on the company's present performance in FY 2023.
- To project income for the fiscal years 2024–2028, we used data from the previous five years (2019–2023).
Estimated Income Statement (₹ in lakhs)
|
|
Mar-24 |
Mar-25 |
Mar-26 |
Mar-27 |
Mar-28 |
|
|
2024-E |
2025-E |
2026-E |
2027-E |
2028-E |
|
Revenue |
7,59,123 |
11,49,327 |
15,42,448 |
20,70,759 |
27,80,792 |
|
COGS |
5,40,431 |
8,21,008 |
11,03,665 |
14,83,633 |
19,94,417 |
|
Gross Profit |
2,18,692 |
3,28,318 |
4,38,784 |
5,87,126 |
7,86,375 |
|
Excise Duty |
73,461 |
73,461 |
73,461 |
73,461 |
73,461 |
|
Employee Expenses |
44,912 |
68,229 |
91,719 |
1,23,296 |
1,65,744 |
|
Other Expenses |
5,795 |
1,11,243 |
1,49,542 |
2,01,027 |
2,70,236 |
|
EBITDA |
1,67,986 |
1,48,846 |
1,97,523 |
2,62,803 |
3,50,395 |
|
Depreciation |
12,325 |
14,101 |
16,868 |
20,749 |
26,115 |
|
EBIT |
1,55,661 |
1,34,745 |
1,80,655 |
2,42,054 |
3,24,280 |
|
Financial Cost |
7,737 |
5,768 |
10,089 |
15,868 |
23,607 |
|
EBT |
1,47,924 |
1,28,977 |
1,70,566 |
2,26,186 |
3,00,673 |
|
Tax expenses |
6,516 |
4,858 |
8,498 |
13,365 |
19,884 |
|
PAT |
67,947 |
50,658 |
88,607 |
1,39,360 |
2,07,329 |
Nayan Nahar Shubham Titvilasi
Equity Research Analyst Equity Research Analyst
Ph: 8149629086 Ph: 7415440968
Email: nayannahar23@gmail.com Email: shubham.titvilasi@gmail.com
Disclaimer: This report is only for the information of our customer Recommendations, opinions, or suggestions are given with the understanding that readers acting on this information assume all risks involved. The information provided herein is not to be construed as an offer to buy or sell securities of any kind.
- Share :


Post a Comment
|
DISCLAIMER |
This report is only for the information of our customers. Recommendations, opinions, or suggestions are given with the understanding that readers acting on this information assume all risks involved. The information provided herein is not to be construed as an offer to buy or sell securities of any kind. ATS and/or its group companies do not as assume any responsibility or liability resulting from the use of such information.