TALBROS AUTOMATIVE COMPONENTS LIMITED RESEARCH REPORT
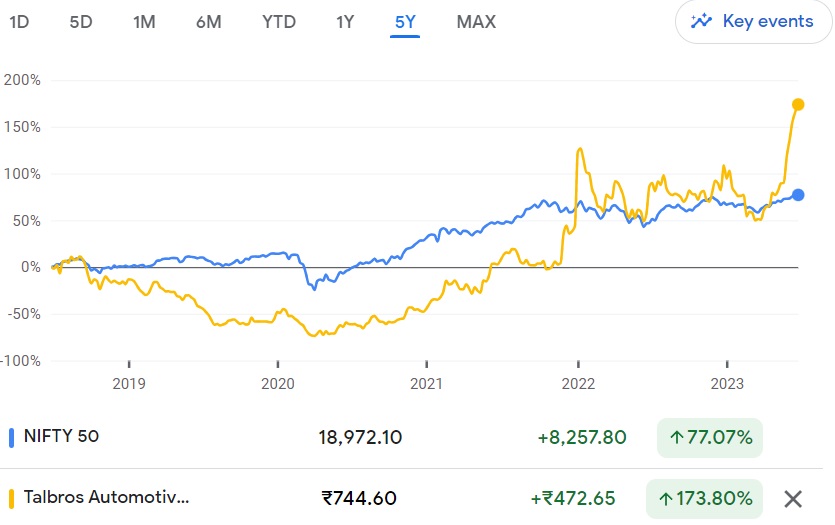
Market Price: ₹743 Recommendation: BUY Target: ₹996 Time Horizon: 1 Year
Q4FY2023 REVIEW
Talbros Automotive Components Limited reported net revenue of ₹174.95 crores for the quarter ended March 31, 2023, compared to ₹148.05 crores for March 31, 2022. Profit After Tax was ₹16.88 crores for the quarter ended March 31, 2023, compared to ₹12.60 crores during the corresponding quarter of the previous year, respectively.
OVERVIEW
- Across its business divisions, product sectors, and JVs, TACL has received new multi-year orders totaling more than ₹1,000 crores from both local and foreign clients in FY 2022–23.
- These orders, which span the company's product lines for gaskets, heat shields, forgings, and chassis, are to be carried out over the next five years.
- These purchases will assist the company in acquiring market share in the ensuing years by increasing our share with both current and potential clients globally.
BENCHMARK COMPARISON
Beta: 1.11 |
Alpha: 55.58 |
Risk Reward Ratio: 1.61 |
Margin of Safety: 25% |
STOCK DATA
|
52 Week H/L |
764/369 |
|
Market Cap (crores) |
917 |
|
Face Value (₹) |
10.00 |
|
Book Value |
297.69 |
|
EPS TTM |
45.02 |
|
NSE Code |
TALBROAUTO |
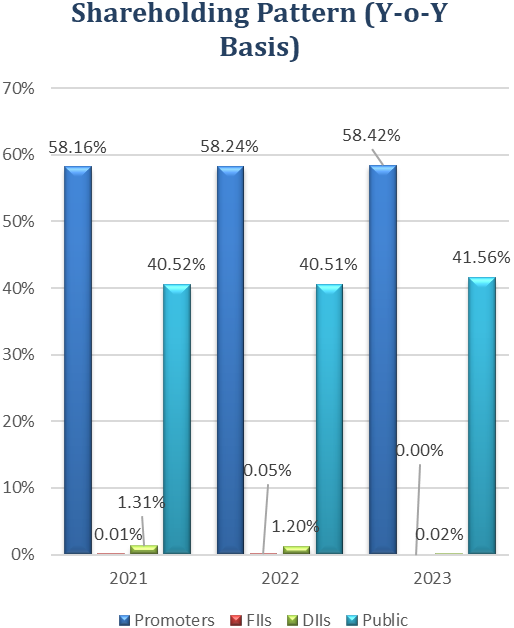
SHAREHOLDING PATTERN (%)
|
|
Sep-22 |
Dec-22 |
Mar-23 |
|
Promoter |
58.32 |
58.32 |
58.42 |
|
Public |
41.66 |
41.59 |
41.56 |
|
FIIs |
0.00 |
0.09 |
0.00 |
|
DIIs |
0.02 |
0.02 |
|
BUSINESS
- In conjunction with Coopers Payen of the UK, Talbros Automotive Components Limited, the Talbros Group's flagship manufacturing firm, was founded in 1956 with the goal of producing automotive and industrial gaskets.
- As a mother brand of gaskets, chassis, rubber goods, and forgings in India today, Talbros stands tall and with pride. Additionally, a Mercedes Benz dealership for passenger vehicles is part of the Talbros Group portfolio.
- Along with 11 production plants in Haryana, Uttarakhand, and Maharashtra, TACL also has a materials division in Gurgaon and a research and development facility in Faridabad. The facilities are set up to competitively design, develop, and produce items following client needs. The business collaborates technically with Sanwa Packaging and Nippon Leakless Corporation, both of Japan.
- Along with a strong distribution network in the aftermarket, a few of the company's well-known clients include Bajaj Auto, Volvo Eicher India, Ashok Leyland, Force Motors, Hero MotoCorp, Honda, Hyundai, John Deere, Mahindra & Mahindra, Maruti Suzuki, Suzuki, TAFE, Daimler India, Tata Motors, Simpsons, Carraro, Dana, Musashi, Spicer, GE, and QH Talbros.
- The company's product portfolio includes:
- Gaskets
- Heat shields
- Forgings
- Chassis and suspension systems
- Anti-vibration components
- Hoses
- To expand its product portfolio and market reach, Talbros has entered into joint partnerships and other strategic alliances. International businesses including Marugo Rubber Industries Ltd. from Japan, Cramlington Precision Forge Ltd. from the UK, and SEJIN India Pvt. Ltd. from South Korea have collaborated with them. These partnerships make it possible to transfer technology, share information, and reach new markets.
SWOT ANALYSIS
STRENGTH
- Diversified product portfolio.
- Technological Expertise.
- Strong Customer relationships.
WEAKNESS
- Dependence on the Automotive Industry.
- Reliance on a few new customers.
- Limited geographical presence.
OPPORTUNITIES
- Growing Automotive Industry.
- Increasing demand for electric vehicles.
- Strategic partnerships and acquisitions.
THREAT
- Supply chain disruptions.
- Regulatory changes.
- Intense competition
AUTO COMPONENTS INDUSTRY ANALYSIS
- India’s automotive gasket market is projected to grow at a CAGR of 5.5% from 2023 to 2026. The growth of the market is being driven by the increasing demand for passenger cars and light commercial vehicles (LCVs) in emerging economies such as China, India, and Brazil. The rising demand for electric vehicles (EVs) is also expected to boost the growth of the market in the coming years.
- Here are some of the key factors driving the growth of the automotive gasket market:
- o Increasing demand for passenger cars and LCVs: The global automotive industry is growing at a steady pace, and this is leading to an increase in the demand for passenger cars and LCVs. These vehicles require a variety of gaskets and seals, which is driving the growth of the market.
- o Rising demand for EVs: The demand for EVs is growing rapidly, and this is expected to boost the growth of the automotive gasket market in the coming years. EVs require a different set of gaskets and seals than conventional vehicles, and this is creating new opportunities for market players.
- o Stringent emission regulations: Governments across the world are introducing stringent emission regulations, which are forcing automakers to adopt new technologies. This is leading to the use of new materials and designs for gaskets and seals, which is driving the growth of the market.
- o Growing focus on fuel efficiency: Automakers are focusing on improving the fuel efficiency of their vehicles, and this is leading to the use of lightweight and high-performance gaskets and seals. This is expected to boost the growth of the market in the coming years.
- The revenue for the automotive component sector is projected to expand by 5-8% in FY 2024, driven by higher domestic demand.
- With the growing premiumization of automobiles, an emphasis on localization, and enhanced export and regulatory standards, the sector is anticipated to reach revenue levels of over 2.5 lakh crore. Over the long run, auto component suppliers are anticipated to record an increase.
- The sector's income increased by more than a fourth from the same period last year in the first nine months of FY23. The sector is also anticipated to spend more than 20,000 crores in capex in FY 2024, with further expenditures going towards the inclusion of new products, the development of products for committed platforms, the development of advanced technologies, and the development of EV components.
- As the major Western markets of the U.S. and Europe move towards electric cars, the local component sector stands to benefit from the outsourcing of the production of ICE components to India.
FINANCIAL OVERVIEW
QUARTERLY SUMMARY
|
Quarterly (INR in lakhs) |
Mar-23 |
Dec-22 |
Sep-22 |
Jun-22 |
Mar-22 |
|
Revenue from Operations |
17,494.60 |
15,853.12 |
16,073.35 |
15,297.25 |
14,804.60 |
|
Other income |
192.34 |
112.98 |
143.98 |
170.65 |
186.20 |
|
Total Income |
17,686.94 |
15,966.10 |
16,217.33 |
15,467.90 |
14,990.80 |
|
|
|
|
|
|
|
|
Total Expenditure |
15,587.78 |
14,217.02 |
14,608.67 |
13,947.53 |
13,283.48 |
|
EBIT |
2,099.16 |
1,749.08 |
1,608.66 |
1,520.37 |
1,707.32 |
|
|
|
|
|
|
|
|
Finance cost |
316.15 |
327.08 |
265.03 |
227.61 |
278.74 |
|
EBT Before Profit/(Loss) of JV |
1,783.01 |
1,422.00 |
1,343.63 |
1,292.76 |
1,428.58 |
|
|
|
|
|
|
|
|
Profit/(Loss) of JV |
359.02 |
304.61 |
302.67 |
221.07 |
257.91 |
|
PBT |
2,142.03 |
1,726.61 |
1,646.30 |
1,513.83 |
1,686.49 |
|
|
|
|
|
|
|
|
Tax Expenses |
453.54 |
352.80 |
341.11 |
323.62 |
425.82 |
|
PAT |
1,688.49 |
1,373.81 |
1,305.19 |
1,190.21 |
1,260.67 |
PROFIT AND LOSS STATEMENT (₹ in lakhs)
|
|
Mar-21 |
Mar-22 |
Mar-23 |
|
Revenue from Operations |
44,419.72 |
57,724.03 |
64,718.32 |
|
Other Income |
895.42 |
767.36 |
619.95 |
|
Total Income |
45,315.14 |
58,491.39 |
65,338.27 |
|
|
|
|
|
|
Cost of Goods sold |
23,824.78 |
30,646.14 |
35,112.28 |
|
Gross Profit |
21,490.36 |
27,845.25 |
30,225.99 |
|
|
|
|
|
|
Excise Duty |
- |
- |
- |
|
Employee Benefits Expense |
5,387.15 |
6,510.52 |
7,069.39 |
|
Other Expenses |
9,639.84 |
13,016.75 |
13,806.99 |
|
EBITDA |
6,463.37 |
8,317.98 |
9,349.61 |
|
|
|
|
|
|
Depreciation and Amortisation Expense |
2,298.28 |
2,288.65 |
2,372.34 |
|
EBIT |
4,165.09 |
6,029.33 |
6,977.27 |
|
|
|
|
|
|
Finance Costs |
1,348.66 |
1,176.73 |
1,135.87 |
|
EBT before Share of Profit/(Loss) of Joint Venture and Associates |
2,816.43 |
4,852.60 |
5,841.40 |
|
|
|
|
|
|
Share of Profit/(Loss) of Joint Venture and Associates |
552.27 |
783.67 |
1,187.37 |
|
EBT before Exceptional Items |
3,368.70 |
5,636.27 |
7,028.77 |
|
|
|
|
|
|
Exceptional Items |
1,811.94 |
- |
- |
|
EBT |
5,180.64 |
5,636.27 |
7,028.77 |
|
|
|
|
|
|
Tax Expense |
1,267.57 |
1,147.65 |
1,471.07 |
|
PAT Non-Controlling Interests |
3,913.07 |
4,488.62 |
5,557.70 |
|
|
|
|
|
|
Non-Controlling Interests |
- |
- |
- |
|
PAT |
3,913.07 |
4,488.62 |
5,557.70 |
|
|
|
|
|
|
EPS |
|
|
|
|
Basic |
31.70 |
36.36 |
45.02 |
|
Diluted |
31.70 |
36.36 |
45.02 |
|
|
|
|
|
|
Number of Shares |
|
|
|
|
Basic |
123.46 |
123.46 |
123.46 |
|
Diluted |
123.46 |
123.46 |
123.46 |
Balance Sheet (₹ in lakhs)
|
|
Mar-21 |
Mar-22 |
Mar-23 |
|
ASSETS: |
|
|
|
|
Non-Current Assets: |
|
|
|
|
Property, Plant and Equipment |
14,538.48 |
15,330.72 |
16,796.34 |
|
Capital Work-in-Progress |
303.96 |
325.02 |
477.73 |
|
Investment Property |
313.95 |
297.96 |
282.14 |
|
Intangible Assets |
123.52 |
92.20 |
67.31 |
|
Intangible Assets under development |
- |
- |
- |
|
Investment Accounted for Using the Equity method |
5,169.54 |
5,953.53 |
7,136.47 |
|
Finance Assets: |
|
|
|
|
Investments |
2,146.00 |
3,838.14 |
5,527.32 |
|
Loans |
- |
- |
- |
|
Other Financial Assets |
159.47 |
186.00 |
279.83 |
|
Current Tax Assets |
- |
213.16 |
224.05 |
|
Other Non-Current Assets |
246.82 |
452.98 |
364.30 |
|
Total Non-Current Assets |
23,001.74 |
26,689.71 |
31,155.49 |
|
|
|
|
|
|
Current Assets: |
|
|
|
|
Inventories |
10,214.53 |
11,425.41 |
13,253.21 |
|
Financial Assets: |
|
|
|
|
Trade Receivables |
15,496.68 |
15,146.66 |
16,853.21 |
|
Cash and Cash Equivalents |
274.98 |
205.55 |
528.41 |
|
Other Bank Balances |
907.41 |
332.05 |
281.95 |
|
Loans |
441.11 |
428.52 |
388.20 |
|
Other Financial Assets |
300.97 |
233.86 |
140.36 |
|
Other Current Assets |
2,249.90 |
2,488.82 |
2,977.58 |
|
Total Current Assets |
29,885.58 |
30,260.87 |
34,422.92 |
|
|
|
|
|
|
Total Assets |
52,887.32 |
56,950.58 |
65,578.41 |
|
|
|
|
|
|
EQUITY AND LIABILITIES: |
|
|
|
|
Equity: |
|
|
|
|
Equity Share Capital |
1,234.56 |
1,234.56 |
1,234.56 |
|
Other Equity |
23,517.97 |
28,953.67 |
35,517.35 |
|
Equity Attributable to the Owners |
24,752.53 |
30,188.23 |
36,751.91 |
|
|
|
|
|
|
Non-Controlling Interest |
- |
- |
- |
|
Total Equity |
24,752.53 |
30,188.23 |
36,751.91 |
|
|
|
|
|
|
Liabilities: |
|
|
|
|
Non-Current Liabilities: |
|
|
|
|
Financial Liabilities |
|
|
|
|
Borrowings |
1,410.79 |
761.68 |
608.48 |
|
Lease Liabilities |
17.07 |
3.72 |
- |
|
Other Financial Liabilities |
6.11 |
9.05 |
22.89 |
|
Provisions |
225.35 |
204.03 |
198.43 |
|
Deferred Tax Liabilities |
550.03 |
1,105.06 |
1,453.21 |
|
Other Non-Current Liabilities |
66.68 |
24.49 |
78.86 |
|
Total Non-Current Liabilities |
2,276.03 |
2,108.03 |
2,361.87 |
|
|
|
|
|
|
Current Liabilities: |
|
|
|
|
Financial Liabilities: |
|
|
|
|
Borrowings |
8,870.91 |
8,137.91 |
8,075.13 |
|
Lease Liabilities |
19.42 |
15.00 |
5.63 |
|
Trade Payables: |
|
|
|
|
Total Outstanding Dues of Micro and Small Enterprises |
162.40 |
103.93 |
305.91 |
|
Other Creditors |
14,777.06 |
15,210.46 |
16,586.20 |
|
Other Financial Liabilities |
908.38 |
707.14 |
839.76 |
|
Other Current Liabilities |
395.27 |
376.32 |
531.32 |
|
Provisions |
89.13 |
103.56 |
120.68 |
|
Current Tax Liabilities |
636.19 |
- |
- |
|
Total Current Liabilities |
25,858.76 |
24,654.32 |
26,464.63 |
|
|
|
|
|
|
Total Equity & Liabilities |
52,887.32 |
56,950.58 |
65,578.41 |
Cash Flow Statement (₹ in lakhs)
|
|
Mar-21 |
Mar-22 |
Mar-23 |
|
Net Profit Before Tax |
5,180.64 |
5,636.27 |
7,028.77 |
|
Net Cash from Operating Activities |
6,619.09 |
5,168.83 |
5,658.48 |
|
Net Cash Used for Investing Activities |
-189.25 |
-2,534.61 |
-3,704.81 |
|
Net Cash From (Used For) Financing Activities |
-6,525.80 |
-2,703.65 |
-1,630.81 |
|
Net Increase in Cash and Cash Equivalents |
-95.96 |
-69.43 |
322.86 |
|
Cash And Cash Equivalents at The Beginning of The Year |
370.94 |
274.98 |
205.55 |
|
Cash And Cash Equivalents at The End of the Year |
274.98 |
205.55 |
528.41 |
Ratio Analysis
|
|
Mar-21 |
Mar-22 |
Mar-23 |
|
Profitability Ratio |
|
|
|
|
Gross Profit |
48.38% |
48.24% |
46.70% |
|
EBITDA Margin |
14.55% |
14.41% |
14.45% |
|
EBIT Margin |
9.38% |
10.45% |
10.78% |
|
Pre-Tax Margin |
11.66% |
9.76% |
10.86% |
|
Net Profit Margin |
8.81% |
7.78% |
8.59% |
|
|
|
|
|
|
Return on Investment |
|
|
|
|
Return on Asset – ROA |
8% |
8% |
9% |
|
Return on Capital Employed – ROCE |
17% |
20% |
20% |
|
Return on Equity – ROE |
18% |
16% |
17% |
|
|
|
|
|
|
Liquidity Ratio (x) |
|
|
|
|
Current ratio |
1.16 |
1.23 |
1.30 |
|
Quick Ratio |
0.76 |
0.76 |
0.80 |
|
|
|
|
|
|
Solvency Ratio |
|
|
|
|
Debt to Equity |
0.06 |
0.03 |
0.02 |
|
Interest Coverage Ratio |
3 |
5 |
6 |
Technical Analysis
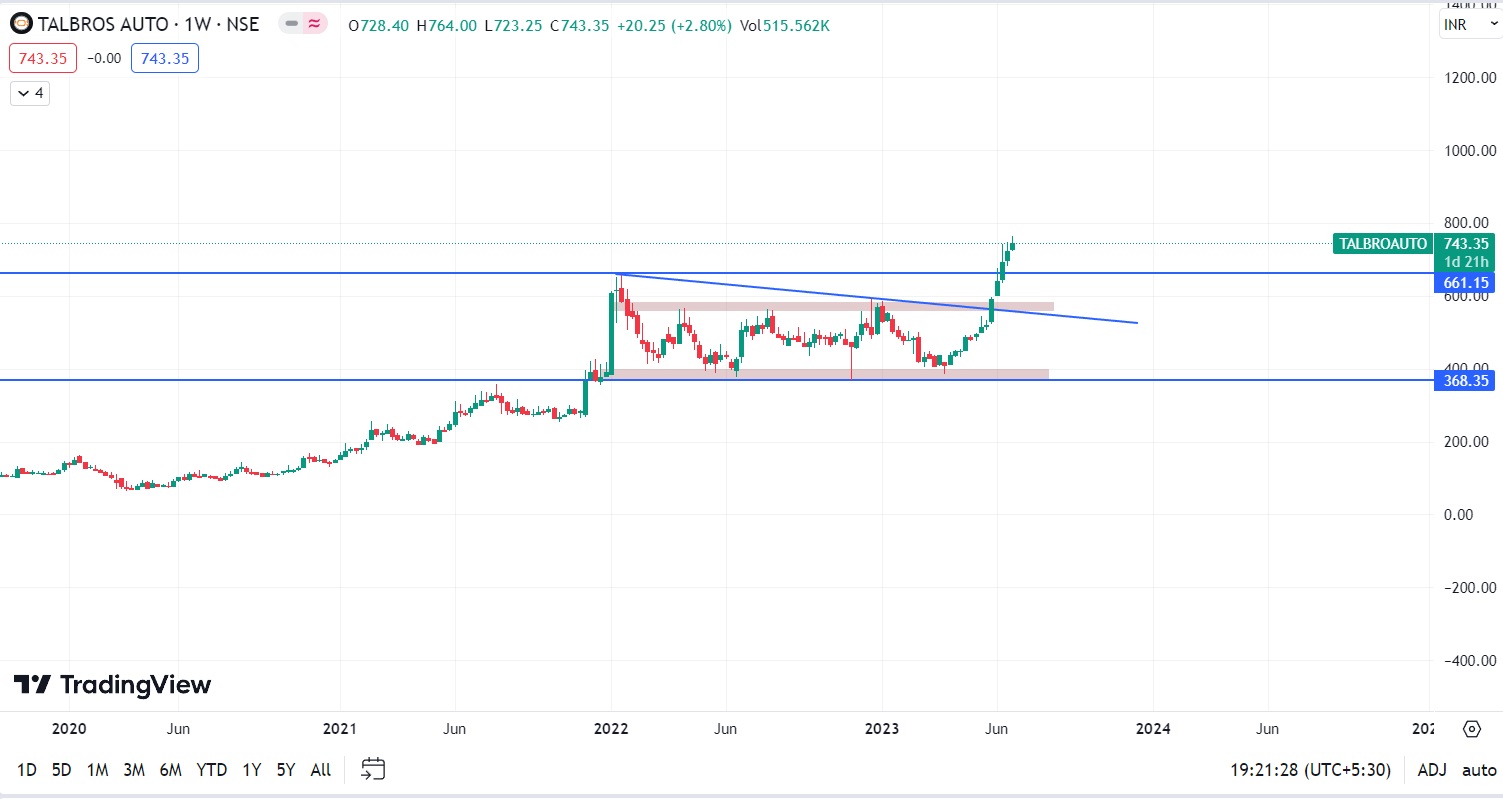
- Stock is in an upward trend on the monthly and weekly chart, ₹368 and ₹661 are support and resistance zone levels.
- It has given a good breakout around ₹593 level and has broken its all-time high level of ₹661.
- One can accumulate this stock at current levels.
CONCALL (Q4FY2023)
- Achieved INR 1,037 crores in sales in FY '22-'23, an increase of 18% YoY. All business lines won multiyear orders totaling around INR 1,000 crores from local and international OEMs. The total revenue for the final quarter of FY 23 was INR 177 crores, an increase of 18% YoY. EBITDA margins for the final quarter of FY '23 were 15.2%.
- A final dividend of INR2 per share with a face value of 10 was issued by the board of directors, bringing the total payout for FY 23 to INR3 per equity share. For FY23, Marelli Talbros Chassis Systems reported a 27% YoY increase in sales or INR105 crores. For FY23, their joint venture Talbros Marugo Rubber Pvt Ltd witnessed a YoY sales rise of 55%, totaling INR42 crores.
- Introducing new markets for LCV, HCV, and off-road segment products, such as Russia and Japan. By FY '27, it hopes to increase profits by double and grow to a firm worth INR 2,200 crores. putting more emphasis on electric vehicles and anticipating INR 250 crores in revenue from EVs by FY27.
- Over the subsequent three to four years, exports should rise from their present 25% level to 35%. Plans call for spending about INR60 crores on forging division over the next four years, commencing this year, with INR18 to 20 crores set aside just for this year. With a total of more than 100 clients, the company is consistently gaining new clients while also expanding the proportion of our existing clientele's business.
- Over 3.9 million passenger automobiles were sold domestically, a 27% rise in the passenger vehicle market. With an increase of 34%, the commercial vehicle category had the second-highest domestic sales.
- All sectors' capacity utilisation in the previous year varied from 85% in the Gasket division and Marugo Rubber Anti-vibration to 55% in Nippon Leakless.
- The firm can expand more than the anticipated 20% to 25%, and the outlook for the short term is favourable. However, due to cost inflation, EBITDA margins cannot increase from one year to the next.
- Optimistic about its potential performance as a worldwide and domestic OEM supplier of automotive components.
Recommendation Rationale
- Experience Management:
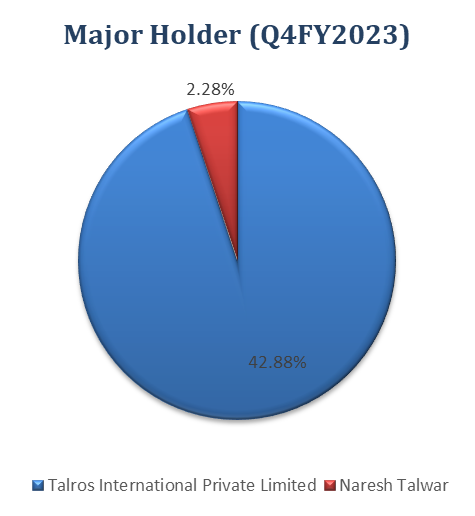
- The Talbros group's flagship firm is TACL, founded in 1956. Mr. Naresh Talwar, the chairman, holds a degree from Delhi University and has 45 years of experience managing the Talbros group in the automotive components sector. In 1986, Mr. Naresh Talwar founded QH Talbros Limited to produce suspension, tie rods, and ball joints. Mr. Umesh Talwar, an MBA from XLRI, Jamshedpur, with 38 years of experience in the automotive components industry, supports him admirably.
- In addition, Mr. Umesh Talwar serves as a promoter director of Nippon Leakless Talbros Private Limited and QH Talbros Limited. Additionally, the management team consists of specialists from the sector with extensive knowledge in the relevant field of company operations.
- Healthy Order Book to Boost Revenue Growth:
- The company received multi-year orders worth more than Rs 1 billion in FY23 from both local and foreign clients for all of its product areas, joint ventures, and business divisions. These contracts, which include the company's product lines such as gaskets, heat shields, forgings, and chassis, will be carried out over the following five years.
- Talbros will be able to increase its market share thanks to the new orders by providing services to both current and potential clients worldwide.
- Known and diverse consumer base, as well as sales from a variety of markets:
- High customer satisfaction and consistent delivery of quality products have established Talbros Group as a trusted partner in the automotive gasket market. With more than 50% market share in India, Talbros Group holds a dominant position in the automotive gasket industry. Their customer base is well-diversified, with no single customer contributing more than 10% of net sales in FY23. This indicates that the group is not overly reliant on any particular customer, reducing the risk associated with dependency on a single client.
- The group serves some of the leading original equipment manufacturers (OEMs) in India, including Bajaj Auto Limited, Tata Cummins Limited, Hero Motorcorp Limited, and Tata Motors Limited. These OEMs are prominent players in the Indian automotive industry, and Talbros' ability to cater to their requirements highlights the group's strong position in the market.
Valuation
- Talbros Automotive Components Limited has shown revenue growth of 7.50% CAGR for FY2019-2023.
- Net Profit has shown a growth rate of 20% CAGR for FY2019-2023.
- The company’s ROE and ROCE are 17% & 20% for FY2023.
- We estimate the company could generate higher revenue and net profit for the following FY 2024, comparable to the prior year, based on the company's present performance in FY 2023.
- To project income for the fiscal years 2024–2028, we used data from the previous five years (2019–2023).
Estimated Income Statement (₹ in lakhs)
|
|
Mar-24 |
Mar-25 |
Mar-26 |
Mar-27 |
Mar-28 |
|
|
2024-E |
2024-E |
2026-E |
2027-E |
2028-E |
|
Revenue |
73,242.04 |
82,102.17 |
92,034.43 |
1,03,168.57 |
1,15,650.05 |
|
COGS |
38,944.74 |
43,663.58 |
48,954.20 |
54,885.87 |
61,536.27 |
|
Gross Profit |
34,297.30 |
38,438.59 |
43,080.23 |
48,282.69 |
54,113.79 |
|
Employee Expenses |
8,054.90 |
9,030.90 |
10,125.15 |
11,351.99 |
12,727.49 |
|
Other Expenses |
15,921.11 |
17,850.24 |
20,013.11 |
22,438.06 |
25,156.83 |
|
EBITDA |
10,321.28 |
11,557.45 |
12,941.96 |
14,492.64 |
16,229.47 |
|
Depreciation |
2,534.44 |
2,609.69 |
2,726.14 |
2,884.35 |
3,085.54 |
|
EBIT |
7,786.84 |
8,947.76 |
10,215.82 |
11,608.30 |
13,143.93 |
|
Financial Cost |
1,267.67 |
1,456.66 |
1,663.09 |
1,889.78 |
2,139.78 |
|
EBT before Share of Profit/(Loss) of Joint Venture and Associates |
6,519.18 |
7,491.10 |
8,552.73 |
9,718.51 |
11,004.15 |
|
Share of Profit/(Loss) of Joint Venture and Associates |
1,325.14 |
1,522.70 |
1,738.50 |
1,975.46 |
2,236.79 |
|
EBT |
7,844.32 |
9,013.81 |
10,291.22 |
11,693.98 |
13,240.95 |
|
Tax expenses |
1,641.76 |
1,886.52 |
2,153.88 |
2,447.46 |
2,771.23 |
|
PAT |
6,202.56 |
7,127.28 |
8,137.35 |
9,246.51 |
10,469.71 |
Nayan Nahar Shubham Titvilasi
Equity Research Analyst Equity Research Analyst
Ph: 8149629086 Ph: 7415440968
Email: nayannahar23@gmail.com Email: shubham.titvilasi@gmail.com
Disclaimer: This report is only for the information of our customer Recommendations, opinions, or suggestions are given with the understanding that readers acting on this information assume all risks involved. The information provided herein is not to be construed as an offer to buy or sell securities of any kind.
- Share :


Post a Comment
|
DISCLAIMER |
This report is only for the information of our customers. Recommendations, opinions, or suggestions are given with the understanding that readers acting on this information assume all risks involved. The information provided herein is not to be construed as an offer to buy or sell securities of any kind. ATS and/or its group companies do not as assume any responsibility or liability resulting from the use of such information.