DIWALI STOCK PICKS FOR SAMVAT 2080
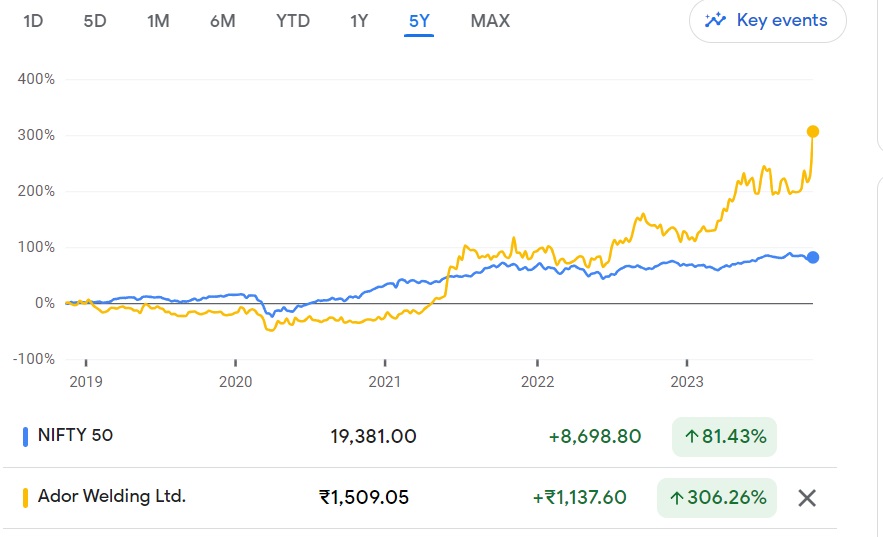
ADOR WELDING LIMITED
Market Price: ₹1503 Recommendation: BUY Target: ₹1950 Time Horizon: 1 Year
Q2FY2024 REVIEW
Ador Welding Limited reported net revenue of ₹229.07 crores for the quarter ended September 30, 2023, compared to ₹186.43 crores for September 30, 2022. Profit After Tax was ₹19.58 crores for the quarter ended September 30, 2023, compared to ₹9.98 crores during the corresponding quarter of the previous year, respectively.
OVERVIEW
BENCHMARK COMPARISON
Beta: 0.64 |
Alpha: 43.03 |
Risk Reward Ratio: 1.50 |
Margin of Safety: 22% |
STOCK DATA
|
52 Week H/L |
1527/753 |
|
Market Cap (crores) |
2,043 |
|
Face Value (₹) |
10.00 |
|
Book Value |
237.88 |
|
EPS TTM |
43.60 |
|
NSE Code |
ADORWELD |
SHAREHOLDING PATTERN (%)
|
|
Mar-23 |
Jun-23 |
Sep-23 |
|
Promoter |
56.90 |
56.90 |
56.90 |
|
Public |
39.78 |
40.08 |
38.96 |
|
DIIs |
2.99 |
2.79 |
4.02 |
|
FIIs |
0.32 |
0.22 |
0.12 |
Recommendation Rationale
- The company benefits from a diversified end-user industry base and a robust distribution network:
- Ador Welding Limited serves a broad spectrum of industries including automobiles, railways, cement, building & construction, pipelines, chemicals, and oil & gas, among others. Additionally, AWL boasts a robust distribution network with over 220 distributors both domestically and internationally.
- The diversified end-user industry focus, combined with a PAN India presence, enables the company to mitigate the risk of obsolescence in the face of emerging technologies and overcome potential industry-specific slowdowns, fostering sustained growth.
- A well-established and enduring presence, coupled with a formidable market position:
- AWL incorporated in 1951 by J. B. Advani & Company (holding a 50.01% stake), the inaugural company of the Ador group, benefits from extensive management experience, providing a deep understanding of market dynamics. The company has nurtured enduring relationships with suppliers and customers, including key industry players, and has cultivated a robust distributor network.
- With a longstanding industry presence and a formidable distribution network, AWL has successfully solidified its market position and garnered brand recognition, notably under the brand name ADOR, particularly in the consumables segment.
- Balanced working capital cycle and Robust financial standing:
- The working capital cycle has shown improvement, with gross current assets declining to 84 days as of March 31, 2023, from 120 days as of March 31, 2020. This positive trend is attributed to reductions in both debtor and inventory days. The company has achieved a decrease in debtor days by shortening credit periods to distributors and ensuring timely payments.
- Furthermore, AWL exhibits a robust financial profile, underscored by a strong net worth. The company's debt protection measures remain healthy, thanks to prudent leverage and sustained profitability. Notably, the interest coverage stands at 39.78 times, and the Debt-to-Equity ratio is 0.05 times for FY 2023.
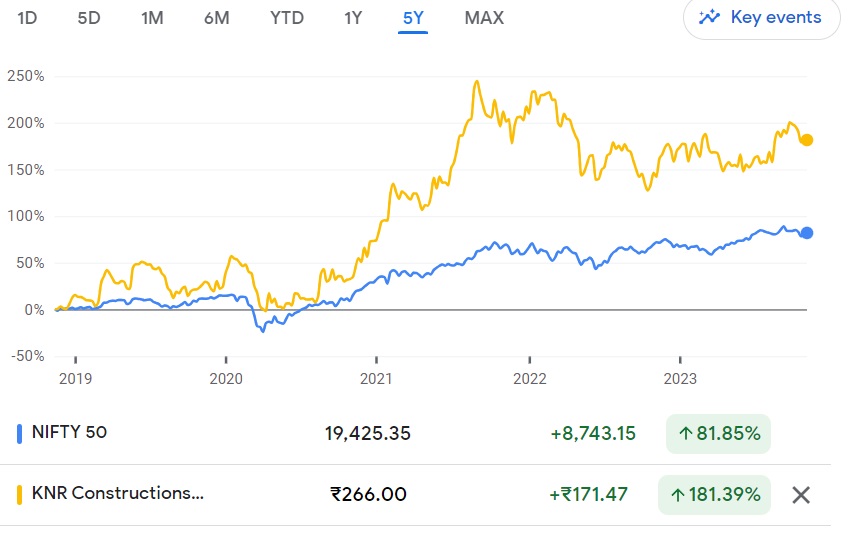
KNR CONSTRUCTION LIMITED
Market Price: ₹265 Recommendation: BUY Target: ₹335 Time Horizon: 1 Year
Q1FY2024 REVIEW
KNR Construction Limited reported net revenue of ₹988.59 crores for the quarter ended June 30, 2023, compared to ₹990.57 crores for June 30, 2022. Profit After Tax was ₹133.25 crores for the quarter ended June 30, 2023, compared to ₹90.53 crores during the corresponding quarter of the previous year, respectively.
OVERVIEW
- As of October 13, 2023, the company has been granted a Provisional Certificate of Completion for the "two-laning with paved shoulder" project, covering the stretch from Km 51.000 to Km 221.833 of SH-85 in the State of Karnataka, India. This project, spanning 166 km, operates on a Hybrid Annuity Basis under Karnataka State Highways Improvement Project – III. Notably, specific sections, such as the Huliyudurga bypass (Km 76.520 to 78.410), SH 84 (Km 88.700 to 90.380), and NH 150 A in Nagmangala (Km 111.960 to Km 113.260), are excluded from this certification.
BENCHMARK COMPARISON
Beta: 0.64 |
Alpha: 14.52 |
Risk Reward Ratio: 1.45 |
Margin of Safety: 20% |
STOCK DATA
|
52 Week H/L |
291/225 |
|
Market Cap (crores) |
7,422 |
|
Face Value (₹) |
2.00 |
|
Book Value |
97.40 |
|
EPS TTM |
16.29 |
|
NSE Code |
KNRCON |
SHAREHOLDING PATTERN (%)
|
|
Mar-23 |
Jun-23 |
Sep-23 |
|
Promoter |
56.90 |
56.90 |
56.90 |
|
Public |
39.78 |
40.08 |
38.96 |
|
DIIs |
2.99 |
2.79 |
4.02 |
|
FIIs |
0.32 |
0.22 |
0.12 |
Recommendation Rationale
- The current order book position is substantial; however, the pivotal factor lies in securing additional orders:
- As of the end of June 2023, KNRCL boasted a substantial order book totaling ₹80,452 million, which includes ₹17,800 million in orders pending execution. This equates to a robust 2.1 times the revenue visibility for FY23. Notably, approximately 64.8% of KNRCL's outstanding order book comes from National Highways Authority of India projects, encompassing both the Hybrid Annuity Model (HAM) and engineering, procurement, and construction (EPC) contracts. Additionally, Asian Development Bank-supported projects, specifically the Karnataka State Highway Improvement Plan under the HAM model and the Chennai Kanyakumari Link Road, contribute another 4.8%, cumulatively representing 69% of the order book from reliable entities such as central bodies and multilaterals.
- The government of Telangana contributes significantly to the order book, accounting for 22%, primarily in irrigation and EPC orders. Meanwhile, the government of Tamil Nadu holds a 7.5% share. Geographically, the entire order book is concentrated in Southern India, with Karnataka at 27%, Kerala at 24%, Telangana at 22%, Andhra Pradesh at 16%, and Tamil Nadu at 10%.
- Consistent robust operational performance; the trajectory of revenue growth is expected to persist:
- KNRCL has demonstrated a robust operating performance, achieving a 15% CAGR in operating revenue from FY20 to FY23. In FY23, the company's operating revenue grew by 14% YoY to ₹37,437 million, propelled by strong operational performance and a substantial order book. In 1QFY24, KNRCL sustained this growth, with operating revenues increasing by 4% YoY to ₹9,295 million.
- KNRCL has consistently been a leader in the industry in terms of profitability, maintaining EBITDA margins around 20% from FY18 to FY23. This stability in EBITDA margins can be attributed to the management's prudent bidding strategy, involvement in high-margin irrigation projects, strategic project bids in southern India, where the company has a strong presence facilitating the smooth supply of raw materials, and efficient machinery mobilization and execution, resulting in lower subcontracting expenses.
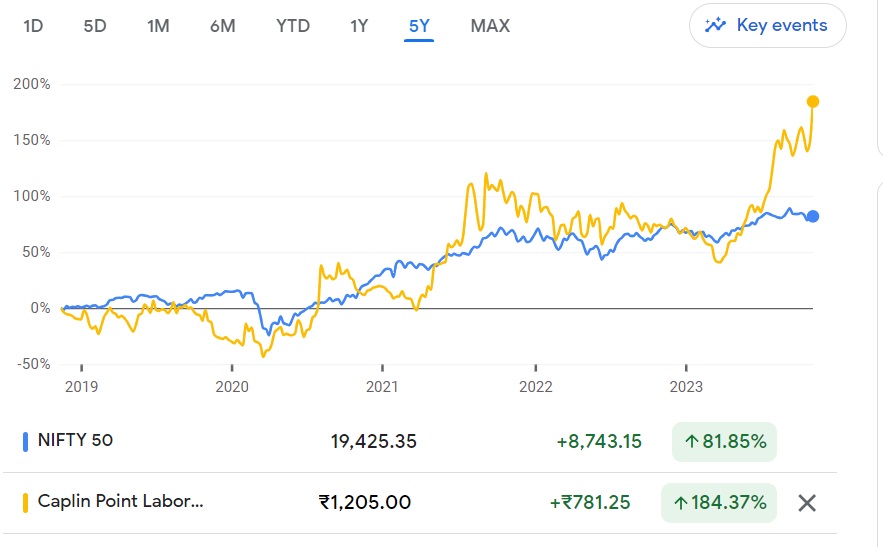
CAPLIN POINT LABORATORIES LIMITED
Market Price: ₹1199 Recommendation: BUY Target: ₹1432 Time Horizon: 1 Year
Q2FY2024 REVIEW
Caplin Point Laboratories Limited reported net revenue of ₹430.49 crores for the quarter ended September 30, 2023, compared to ₹375.33 crores for September 30, 2022. Profit After Tax was ₹116 crores for the quarter ended September 30, 2023, compared to ₹92.03 crores during the corresponding quarter of the previous year, respectively.
OVERVIEW
- Caplin Steriles Limited (Caplin), a subsidiary of Caplin Point Laboratories Limited, has received final approval from the United States Food and Drug Administration (USFDA) for its Abbreviated New Drug Application (ANDA) for Norepinephrine Bitartrate Injection USP, 4 mg/4 mL (1 mg/mL) Single-Dose Vial. This approval establishes it as a generic therapeutic equivalent to LEVOPHED injection by Hospira Inc.
BENCHMARK COMPARISON
Beta: 0.64 |
Alpha: 23.39 |
Risk Reward Ratio: 1.32 |
Margin of Safety: 16% |
STOCK DATA
|
52 Week H/L |
1230/575 |
|
Market Cap (crores) |
9,105 |
|
Face Value (₹) |
2.00 |
|
Book Value |
241 |
|
EPS TTM |
49 |
|
NSE Code |
CAPLINPOINT |
SHAREHOLDING PATTERN (%)
|
|
Mar-23 |
Jun-23 |
Sep-23 |
|
Promoter |
70.66 |
70.63 |
70.62 |
|
Public |
26.33 |
26.44 |
26.08 |
|
DIIs |
0.64 |
0.27 |
0.21 |
|
FIIs |
2.36 |
2.68 |
3.09 |
Recommendation Rationale
- Experienced Management and Strong Distribution Network:
- With a cumulative experience of over 30 years in the pharmaceutical industry, the management team at Caplin Point Laboratories boasts an unparalleled wealth of expertise. Notably, the contributions of Mr. C.C. Paarthipan and Dr. Sridhar Ganesan have played a pivotal role in propelling the company to its esteemed position today. This leadership, coupled with other talented individuals, has been instrumental in shaping the company into a top-tier player within the industry. In addition to its exceptional leadership, Caplin Point Laboratories has built a formidable distribution network that spans across 26 countries.
- By engaging in direct marketing to pharmacies and wholesalers, the company is pioneering a strategy that bypasses traditional trade channels. Presently, 20% of the company's revenue is generated from direct sales, a testament to the effectiveness of this approach. Furthermore, plans to widen the interface to include 15,000 pharmacies will not only address bottom-of-the-pyramid customers but also facilitate meaningful engagement with healthcare professionals, such as doctors.
- Geographical Expansion and Diversified Product Profile.
- Caplin Point Laboratories is expanding into the US market through its subsidiary, Caplin Steriles USA Inc. The incorporation process is underway, with completion expected in 6-8 months. The company has 7 ANDAs awaiting FDA review for injectables and ophthalmics. With 23 ANDA approvals, including 18 under CSL, they plan to submit 10+ ANDAs next year, spanning various pharmaceutical categories. Their pipeline holds 55+ ANDAs, targeting a $5 billion market in the US. Presently, Caplin Point Laboratories offers a broad portfolio of over 4,000 registered products and 650 formulations across 36 therapeutic segments, showcasing its commitment to diverse healthcare solutions.
- Stable Financial Risk Profile:
- Caplin Point has earmarked a Capex budget of around ₹500-550 Crores for strategic investments. This investment is targeted at bolstering current production capabilities, expanding the product lineup, and achieving backward integration for a major portion of offerings. The funding for this Capex will be entirely sourced from internal accruals, ensuring the Company maintains a net cash-positive stance throughout the initiative. Caplin's consistent strong financial performance over the past five quarters positions it favorably for these endeavors.
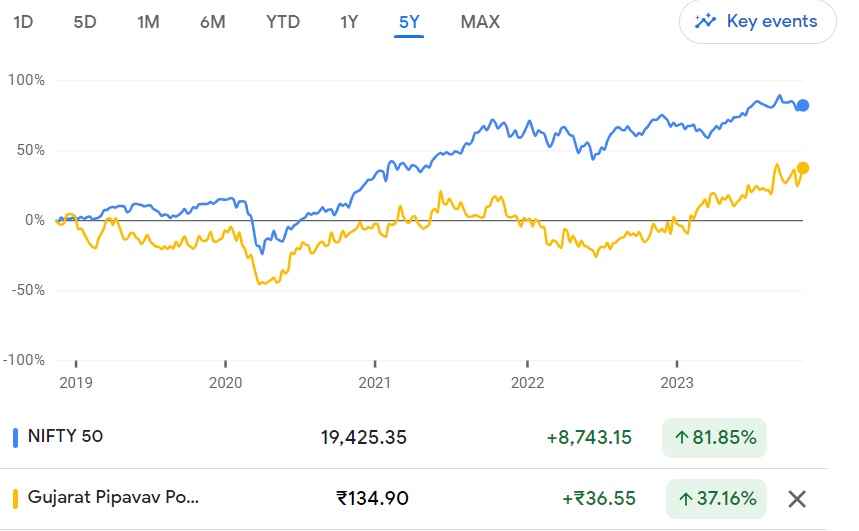
GUJARAT PIPAPAV PORT LIMITED
Market Price: ₹135 Recommendation: BUY Target: ₹259 Time Horizon: 1.5 Year
Q2FY2024 REVIEW
Gujarat Pipapav Port Limited reported net revenue of ₹270.43 crores for the quarter ended September 30, 2023, compared to ₹237.87 crores for September 30, 2022. Profit After Tax was ₹92.28 crores for the quarter ended September 30, 2023, compared to ₹72.12 crores during the corresponding quarter of the previous year, respectively.
OVERVIEW
- In a meeting held on November 8, 2023, the Board of Directors of Gujarat Pipavav Port Limited sanctioned the disbursement of an Interim Dividend amounting to ₹3.60 for the financial year 2023-24 to the Company's members. Additionally, the Board designated Tuesday, November 21, 2023, as the Record Date to ascertain the eligibility of members to receive the dividend amount.
BENCHMARK COMPARISON
Beta: 0.54 |
Alpha: 8.17 |
Risk Reward Ratio: 2.00 |
Margin of Safety: 35% |
STOCK DATA
|
52 Week H/L |
142/85 |
|
Market Cap (crores) |
6,526 |
|
Face Value (₹) |
10.00 |
|
Book Value |
47.80 |
|
EPS TTM |
6.48 |
|
NSE Code |
GPPL |
SHAREHOLDING PATTERN (%)
|
|
Mar-23 |
Jun-23 |
Sep-23 |
|
Promoter |
44.01 |
44.01 |
44.01 |
|
Public |
11.98 |
12.32 |
14.65 |
|
DIIs |
22.13 |
22.66 |
21.23 |
|
FIIs |
21.90 |
21.02 |
20.12 |
Recommendation Rationale
- Robust business connections with the parent company:
- The company capitalizes on its parent's expertise, resources, and network to cultivate its business relationships with shipping lines, with Maersk Line being a prominent and sizable customer.
- Additionally, the company gains advantages through access to cutting-edge technology, operational expertise, and industry best practices due to its affiliation with APM Terminals and the ultimate parent, AP Moller-Maersk A/S, which is the parent company of Maersk Line and part of the A P Moller-Maersk group.
- Healthy Revenue Segment:
- GPPL's business risk profile is strongly influenced by the substantial traffic volume it manages through its container capacity of 1.35 million twenty-foot equivalent units (TEUs) and its dry bulk capacity of 4 million tonnes per annum. In the fiscal year 2023, the container volume reached 764,034 TEUs, marking a 21% increase from the previous year's 627,747 TEUs. This notable rise can be primarily attributed to improved sailing schedules of shipping lines and the addition of new services.
- In terms of dry bulk cargo, which primarily consists of coal and fertilizer imports at West Coast Ports, including Pipavav, the port handled 3.91 million metric tons (MT) in FY2023, compared to 4.19 million MT in the previous year. The decrease of over 7% is mainly due to cargo volume moving back to the neighboring captive jetty after it resumed operations following cyclone restoration work.
- On the liquid cargo front, the port managed approximately 1.03 million MT during FY2023, in contrast to 0.81 million MT in the previous year, representing a significant increase of over 28%. This growth can be attributed to the rise in LPG imports.
- Strong Financial Risk Profile:
- The financial risk profile of GPPL is primarily shaped by its substantial net worth of Rs 2,310 crore as of FY2023 and the absence of any debt, leading to a strong financial position. This is further reinforced by the remarkable Interest Coverage ratio of 55x, signifying the company's ability to comfortably meet its interest obligations.
- Over the medium term, GPPL's financial risk remains low, as it only has an annual maintenance capital expenditure (capex) requirement, and these expenses are expected to be easily covered through internal accruals and the existing cash balance. This financial stability and sound management indicate a highly favorable financial risk profile for the company.
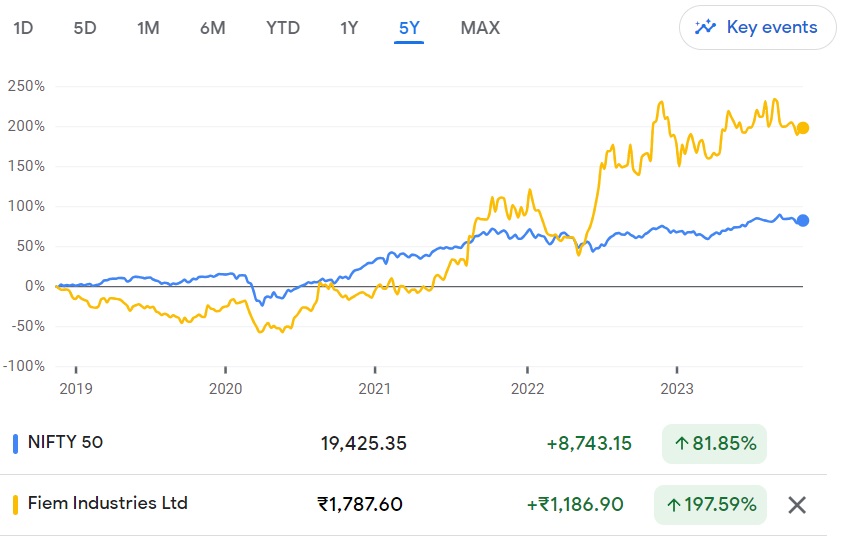
FIEM INDUSTRIES LIMITED
Market Price: ₹1778 Recommendation: BUY Target: ₹2555 Time Horizon: 1 Year
Q2FY2024 REVIEW
FIEM Industries Limited reported net revenue of ₹513.36 crores for the quarter ended September 30, 2023, compared to ₹527.03 crores for September 30, 2022. Profit After Tax was ₹43.48 crores for the quarter ended September 30, 2023, compared to ₹40.77 crores during the corresponding quarter of the previous year, respectively.
OVERVIEW
- On March 20, 2023, Fiem Industries Limited entered into a Memorandum of Understanding (MoU) with Gogoro India Pvt. Ltd., a subsidiary of Gogoro Taiwan, intending to diversify their product offerings within the 2-wheeler Electric Vehicles (EV) sector. In addition to their existing operations in the Lighting and Rear-View Mirror business, Fiem Industries will now be responsible for producing Hub Motor Assembly, Electric Control Unit (ECU), and Motor Control Unit (MCU) for Gogoro.
BENCHMARK COMPARISON
Beta: 1.18 |
Alpha: 31.74 |
Risk Reward Ratio: 1.74 |
Margin of Safety: 28% |
STOCK DATA
|
52 Week H/L |
2113/1753 |
|
Market Cap (crores) |
2,340 |
|
Face Value (₹) |
10.00 |
|
Book Value |
578 |
|
EPS TTM |
106 |
|
NSE Code |
FIEM |
SHAREHOLDING PATTERN (%)
|
|
Mar-23 |
Jun-23 |
Sep-23 |
|
Promoter |
66.56 |
66.56 |
66.56 |
|
Public |
28.73 |
28.68 |
29.68 |
|
DIIs |
0.80 |
0.81 |
0.86 |
|
FIIs |
3.92 |
3.94 |
2.90 |
Recommendation Rationale
- The company possesses significant expertise in the realm of automotive lighting and signalling equipment:
- FIEM Industries Ltd. (FIEM) was established and officially incorporated in the year 1989 under the leadership of Mr J.K. Jain and he also brings with him a wealth of experience spanning over four decades in the manufacturing of automotive lighting and signaling equipment.
- FIEM is recognized as a prominent manufacturer within India, specializing in the production of Automotive Lighting, Signaling Equipment, and Rear-View Mirrors. Notably, FIEM was one of the pioneering companies in India to introduce LED lights for two-wheelers
- Diversified Product Portfolio and Strong Client Base:
- FIEM Industries stands as one of the foremost manufacturers of automotive lighting, signaling equipment, and rear-view mirrors in India. A substantial portion of its business is dedicated to serving the two-wheeler segment of the automotive industry. The company boasts a diversified product portfolio that spans a wide spectrum of offerings, including headlamps, tail lamps, signaling lamps, roof lamps, rear-view mirrors, wheel covers, warning triangles, complete rear fender assemblies, frame assemblies, mudguards, various automobile sheet metal and plastic components, as well as Canister and Bank (Lean) Angle Sensors.
- FIEM's clientele encompasses well-known names in the automotive industry, such as OLA, Ampere, Revolt, Honda, TVS, Yamaha, Suzuki, Eicher Royal Enfield, Harley Davidson, Mahindra, Tata Marcopolo, Force Motors, Honda Siel, Hyundai, Daimler, Mahindra Reva, and more. This diverse and extensive client base showcases the company's strong presence and reputation within the automotive sector.
- Strong Technology Tie-up and strong order book:
- FIEM's advanced Research and Development (R&D) Center provides clients with design and development capabilities in the fields of Automotive Lighting, Signaling Equipment, and Rear-View Mirrors, all tailored to meet specific client requirements. The in-house R&D unit, located at the Rai Industrial Estate in Sonepat, has received recognition from the Government of India, specifically from the Ministry of Science and Technology's Department of Science and Industrial Research.
- Additionally, the company's order book presently comprises around 85 to 90 projects, with an expectation that 25-30% of the revenue will be realized within the current year.
- Share :


Post a Comment
|
DISCLAIMER |
This report is only for the information of our customers. Recommendations, opinions, or suggestions are given with the understanding that readers acting on this information assume all risks involved. The information provided herein is not to be construed as an offer to buy or sell securities of any kind. ATS and/or its group companies do not as assume any responsibility or liability resulting from the use of such information.