CAPLIN POINT LABORATORIES LIMITED
Market Price: ₹1056 Recommendation: BUY Target: ₹1432 Time Horizon: 1 Year
Q1FY2024 REVIEW
Caplin Point Laboratories Limited reported net revenue of ₹395.32 crores for the quarter ended June 30, 2023, compared to ₹346.33 crores for June, 30, 2022. Profit After Tax was ₹104.23 crores for the quarter ended June 30, 2023, compared to ₹86.31 crores during the corresponding quarter of the previous year, respectively.
OVERVIEW
- Between May 22nd and 31st, the USFDA inspected Caplin Steriles Limited's Sterile Injectable site in Gummidipoondi. The inspection revealed four procedural observations unrelated to data integrity or recurrence. The company is now devising corrective actions for these observations to meet FDA requirements within the stipulated time frame.
- Caplin Steriles Limited, a subsidiary of Caplin Point Laboratories Limited, has received final approval from the USFDA for its Abbreviated New Drug Application (ANDA) for Cisatracurium Besylate Injection USP. This includes various strengths and types of vials, serving as a generic version of AbbVie Inc.'s NIMBEX injection.
BENCHMARK COMPARISON
Beta: 0.20 |
Alpha: 15 |
Risk Reward Ratio: 2.30 |
Margin of Safety: 32% |
STOCK DATA
|
52 Week H/L |
575/1077 |
|
Market Cap (crores) |
7,706 |
|
Face Value (₹) |
2.00 |
|
Book Value |
251.29 |
|
EPS TTM |
49.18 |
|
BSE Code |
CAPLIPOINT |
SHAREHOLDING PATTERN (%)
|
|
Dec-22 |
Mar-23 |
Jun-23 |
|
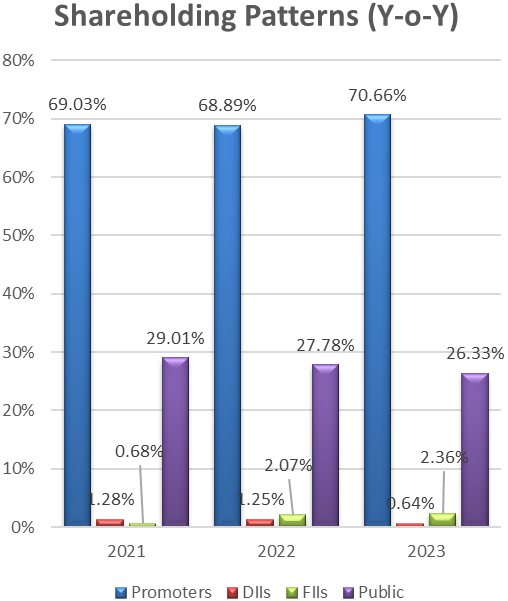
Promoter |
68.80 |
70.66 |
70.63 |
|
Public |
27.84 |
26.33 |
26.44 |
|
DIIs |
1.12 |
0.64 |
0.27 |
|
FIIs |
2.24 |
2.36 |
2.64 |
BUSINESS
- Caplin Point Laboratories Limited operates as a notable pharmaceutical company with a strategic focus on the manufacturing, development, and marketing of generic medications. The company boasts an extensive product portfolio spanning across an impressive 36 therapeutic segments.
- This diverse array includes essential medical categories like anti-infectives, analgesics, antipyretics, anti-diabetic agents, cardiovascular drugs, anti-TB treatments, anti-rheumatic medications, and dermatology products, catering to a wide spectrum of healthcare needs.
- A significant milestone in Caplin Point's history occurred in 1994 when it underwent a transformative event. The company initiated its Initial Public Offering (IPO) process, a pivotal moment that led to its listing on the stock exchange. The IPO was met with an overwhelming response from investors, as it was oversubscribed an impressive 117 times.
- A distinctive feature of Caplin Point's business strategy is its global outreach. The company's products find their way into the pharmaceutical markets of over 23 countries, indicative of its robust international presence.
- Notably, Caplin Point has achieved significant market penetration in regions like Latin America and Francophone Africa, where its products have gained substantial recognition and usage.
- At present, Caplin Point Laboratories Limited boasts an expansive pharmaceutical portfolio, featuring over 4,000 registered products and more than 650 distinct formulations. This diversity spans across 36 therapeutic segments, showcasing the company's comprehensive approach to addressing various medical needs.
- Caplin Point Laboratories is progressing in establishing its presence in the US with the incorporation of Caplin Steriles USA Inc, a subsidiary of Caplin Steriles Ltd. The incorporation process is ongoing, and formalities are expected to conclude in 6-8 months.
- The company has 7 ANDAs under FDA review, covering injectables and ophthalmics. With a total of 23 ANDA approvals, including 18 under CSL, the company plans to file more than 10 ANDAs in the coming year, spanning Emulsion Injections, Suspension Injections, Emulsion Ophthalmic solutions, and Injectable Bags. The company's development pipeline, with 55+ ANDAs, targets an addressable market in the US exceeding $5 billion.
SWOT ANALYSIS
STRENGTH
- Global Presence
- Strong Track record.
- Regulatory Approvals.
WEAKNESS
- Dependency on external factors.
- competition.
OPPORTUNITIES
- US market expansion.
- Product diversification.
- Geographical expansion.
THREAT
- Regulatory challenges.
- Pricing pressure.
- Intellectual property issues.
- Market volatility.
PHARMACEUTICAL SECTOR ANALYSIS
- pharmaceutical industry between FY18 (fiscal year 2018) and FY23 (fiscal year 2023). The industry has seen a compound annual growth rate (CAGR) of 6-8% during this period. This growth has been primarily fueled by an 8% increase in exports and a 6% rise in the domestic market.
- In FY23 (fiscal year 2022-2023), the Indian pharmaceutical market experienced a year-on-year growth of approximately 5%, reaching a total market size of $49.78 billion. This growth was driven by a 3% increase in exports and a 7% rise in the domestic market.
- In FY23, Indian pharmaceutical exports to developed markets grew by 8%, while exports to emerging markets remained stagnant.
- Factors like the Russia-Ukraine conflict, currency scarcity in African nations, and local currency depreciation affected exports to emerging markets. These issues highlighted the complex interplay of geopolitical and economic factors in the industry's export dynamics.
- In FY23, formulation companies in the Indian pharmaceutical sector were able to sustain their margins at approximately 22%, even in the face of pricing challenges within the US generics market. This achievement was primarily attributed to their emphasis on producing complex and specialty products.
- However, in contrast, API/bulk drugs companies experienced a contraction in their operating margins by nearly 170 basis points (bps) year-on-year, resulting in an operating margin of about 18% in FY23.
- The pharmaceutical industry is anticipated to witness a growth rate of 7-8% during FY24-FY25. This growth will be propelled by a 6-7% expansion in exports and an 8-9% rise in the domestic market over the same period.
- raw material prices and freight rates stabilize, and pricing pressure in the US generics market eases, combined with a strategic focus on complex and specialty products, industry players are expected to experience an improvement in their operating margins by 100-150 basis points (bps) over FY24-FY25 compared to FY23-FY24.
- In the medium term, the Indian pharmaceutical sector is projected to maintain a consistent growth trajectory. This growth will be driven by several structural factors, including the aging population, an increase in lifestyle and chronic diseases, heightened healthcare awareness, greater insurance coverage, and expanded government expenditure through various schemes.
- Additionally, the evolving global demographics and the production of complex and specialty generic products are expected to fuel the export growth of Indian pharmaceutical companies. This export growth will also receive a boost from patent expirations in regulated markets, providing further opportunities for expansion.
FINANCIAL OVERVIEW
QUARTERLY SUMMARY
|
Quarterly (INR in crores) |
Jun-23 |
Mar-23 |
Dec-22 |
Sep-22 |
Jun-22 |
|
Revenue from Operations |
395.32 |
389.28 |
372.07 |
359.05 |
346.33 |
|
Other income |
12.05 |
11.40 |
14.15 |
16.48 |
13.94 |
|
Total Income |
407.37 |
400.68 |
386.22 |
375.53 |
360.27 |
|
|
|
|
|
|
|
|
Total Expenditure |
280.17 |
276.48 |
274.13 |
264.93 |
255.12 |
|
EBIT |
127.20 |
124.20 |
112.09 |
110.60 |
105.15 |
|
|
|
|
|
|
|
|
Finance cost |
0.28 |
0.23 |
0.36 |
0.14 |
0.06 |
|
PBT Share of Profit in Associate |
126.92 |
123.97 |
111.73 |
110.46 |
105.09 |
|
|
|
|
|
|
|
|
Share of Profit in Associate |
0.08 |
0.08 |
0.01 |
-0.01 |
- |
|
PBT |
127.00 |
124.05 |
111.74 |
110.45 |
105.09 |
|
|
|
|
|
|
|
|
Tax Expenses |
22.76 |
22.81 |
14.35 |
18.42 |
18.78 |
|
PAT |
104.24 |
101.24 |
97.39 |
92.03 |
86.31 |
PROFIT AND LOSS STATEMENT (₹ in crores)
|
|
Mar-21 |
Mar-22 |
Mar-23 |
|
Revenue from Operations |
1,061.29 |
1,269.41 |
1,466.73 |
|
Other Income |
23.54 |
38.75 |
55.98 |
|
Total Income |
1,084.83 |
1,308.16 |
1,522.71 |
|
|
|
|
|
|
Cost of Goods sold |
471.74 |
557.51 |
663.21 |
|
Gross Profit |
613.09 |
750.65 |
859.50 |
|
|
|
|
|
|
Excise Duty |
- |
- |
- |
|
Employee Benefits Expense |
102.53 |
115.30 |
136.99 |
|
Other Expenses |
158.38 |
201.93 |
225.47 |
|
EBITDA |
352.18 |
433.42 |
497.04 |
|
|
|
|
|
|
Depreciation and Amortisation Expense |
36.97 |
46.90 |
44.99 |
|
EBIT |
315.21 |
386.52 |
452.05 |
|
|
|
|
|
|
Finance Costs |
1.59 |
0.70 |
0.78 |
|
EBT before Share of Profit/(Loss) of Joint Venture and Associates |
313.62 |
385.82 |
451.27 |
|
|
|
|
|
|
Share of Profit/(Loss) of Joint Venture and Associates |
- |
- |
0.08 |
|
EBT before Exceptional Items |
313.62 |
385.82 |
451.35 |
|
|
|
|
|
|
Exceptional Items |
- |
- |
- |
|
EBT |
313.62 |
385.82 |
451.35 |
|
|
|
|
|
|
Tax Expense |
62.19 |
77.37 |
74.36 |
|
PAT Non-Controlling Interests |
251.43 |
308.45 |
376.99 |
|
|
|
|
|
|
Non-Controlling Interests |
-9.16 |
-8.61 |
-0.73 |
|
|
|
|
|
|
PAT |
242.27 |
299.84 |
376.26 |
|
|
|
|
|
|
EPS |
|
|
|
|
Basic |
32.03 |
39.61 |
49.62 |
|
Diluted |
31.74 |
39.26 |
49.18 |
|
|
|
|
|
|
Number of Shares |
|
|
|
|
Basic |
7.56 |
7.57 |
7.58 |
|
Diluted |
7.63 |
7.64 |
7.65 |
Balance Sheet (₹ in crores)
|
|
Mar-21 |
Mar-22 |
Mar-23 |
|
ASSETS |
|
|
|
|
Non-Current Assets: |
|
|
|
|
Property, Plant and Equipment |
296.96 |
276.66 |
267.01 |
|
Capital-Work-Progress |
13.82 |
15.41 |
220.48 |
|
Intangible Assets |
7.23 |
8.53 |
10.94 |
|
Right of Use Assets |
1.15 |
1.38 |
1.86 |
|
Intangible Assets Under Development |
0.06 |
2.32 |
0.23 |
|
Financial Assets: |
|
|
|
|
Investments |
0.66 |
37.01 |
70.52 |
|
Other Financial Assets |
23.69 |
28.71 |
4.19 |
|
Income Tax Assets |
- |
- |
3.46 |
|
Deferred Tax Assets |
- |
6.21 |
13.86 |
|
Other Non-Current Assets |
5.47 |
62.27 |
44.39 |
|
Loans & Advances |
- |
- |
- |
|
Total Non-Current Assets |
349.04 |
438.50 |
636.94 |
|
|
|
|
|
|
Current Assets: |
|
|
|
|
Inventories |
179.01 |
227.31 |
288.22 |
|
Financial Assets: |
|
|
|
|
Investments |
10.54 |
51.97 |
159.17 |
|
Trade Receivables |
279.36 |
320.06 |
394.06 |
|
Cash and Cash Equivalents |
231.57 |
150.76 |
177.56 |
|
Other Bank Balances |
206.76 |
312.23 |
315.92 |
|
Other Financial Assets |
8.44 |
130.84 |
71.93 |
|
Other Current Assets |
98.89 |
104.65 |
147.60 |
|
Total Current Assets |
1,014.57 |
1,297.82 |
1,554.46 |
|
|
|
|
|
|
Total Assets |
1,363.61 |
1,736.32 |
2,191.40 |
|
|
|
|
|
|
EQUITY AND LIABILITIES |
|
|
|
|
Equity: |
|
|
|
|
Equity Share Capital |
15.13 |
15.16 |
15.18 |
|
Instruments Entirely Equity in Nature |
74.58 |
74.58 |
74.58 |
|
Other Equity |
1,096.12 |
1,394.19 |
1,790.72 |
|
Equity Attributable to the Owners |
1,185.83 |
1,483.93 |
1,880.48 |
|
|
|
|
|
|
Non-Controlling Interest |
17.54 |
25.95 |
26.79 |
|
Total Equity |
1,203.37 |
1,509.88 |
1,907.27 |
|
|
|
|
|
|
Liabilities: |
|
|
|
|
Non-Current Liabilities: |
|
|
|
|
Financial Liabilities |
|
|
|
|
Borrowings |
- |
- |
- |
|
Lease Liabilities |
0.53 |
1.17 |
0.93 |
|
Deferred Tax Liabilities |
1.16 |
- |
- |
|
Provisions |
5.36 |
6.06 |
7.78 |
|
Income Tax Liabilities |
0.33 |
2.42 |
- |
|
Other Non-Current Liabilities |
10.01 |
9.11 |
7.42 |
|
Total Non-Current Liabilities |
17.39 |
18.76 |
16.13 |
|
|
|
|
|
|
Current Liabilities: |
|
|
|
|
Financial Liabilities: |
|
|
|
|
Borrowings |
17.07 |
0.50 |
3.41 |
|
Trade Payables: |
- |
- |
- |
|
total outstanding dues of micro and small enterprises |
0.62 |
1.57 |
0.38 |
|
Other Creditors |
87.88 |
154.37 |
163.99 |
|
Lease Liabilities |
0.79 |
0.46 |
0.86 |
|
Other Financial Liabilities |
29.87 |
38.29 |
71.63 |
|
Provisions |
2.48 |
2.56 |
0.28 |
|
Other Current Liabilities |
4.14 |
9.93 |
27.45 |
|
Total Current Liabilities |
142.85 |
207.68 |
268.00 |
|
|
|
|
|
|
Total Equity & Liabilities |
1,363.61 |
1,736.32 |
2,191.40 |
Cash Flow Statement (₹ in lakhs)
|
|
Mar-21 |
Mar-22 |
Mar-23 |
|
Net Profit Before Tax |
313.62 |
385.82 |
451.35 |
|
Net Cash from Operating Activities |
268.61 |
336.73 |
271.65 |
|
Net Cash Used for Investing Activities |
-29.44 |
-376.77 |
-217.86 |
|
Net Cash From (Used For) Financing Activities |
-23.98 |
-40.68 |
-28.17 |
|
Net Increase in Cash and Cash Equivalents |
215.19 |
-80.72 |
25.62 |
|
Cash And Cash Equivalents at The Beginning of The Year |
220.75 |
231.57 |
150.76 |
|
Cash And Cash Equivalents at The End of the Year |
231.57 |
150.76 |
177.56 |
Ratio Analysis
|
|
Mar-21 |
Mar-22 |
Mar-23 |
|
Profitability Ratio |
|
|
|
|
Gross Profit |
57.77% |
59.13% |
58.60% |
|
EBITDA Margin |
33.18% |
34.14% |
33.89% |
|
EBIT Margin |
29.70% |
30.45% |
30.82% |
|
Pre-Tax Margin |
29.55% |
30.39% |
30.77% |
|
Net Profit Margin |
22.83% |
23.62% |
25.65% |
|
|
|
|
|
|
Return on Investment |
|
|
|
|
Return on Asset – ROA |
19% |
19% |
19% |
|
Return on Capital Employed – ROCE |
29% |
28% |
26% |
|
Return on Equity – ROE |
22% |
22% |
22% |
|
|
|
|
|
|
Liquidity Ratio (x) |
|
|
|
|
Current ratio |
7.10 |
6.25 |
5.80 |
|
Quick Ratio |
5.85 |
5.15 |
4.72 |
|
|
|
|
|
|
Solvency Ratio |
|
|
|
|
Debt to Equity |
0.00 |
0.00 |
0.00 |
|
Interest Coverage Ratio |
198 |
552 |
580 |
Technical Analysis
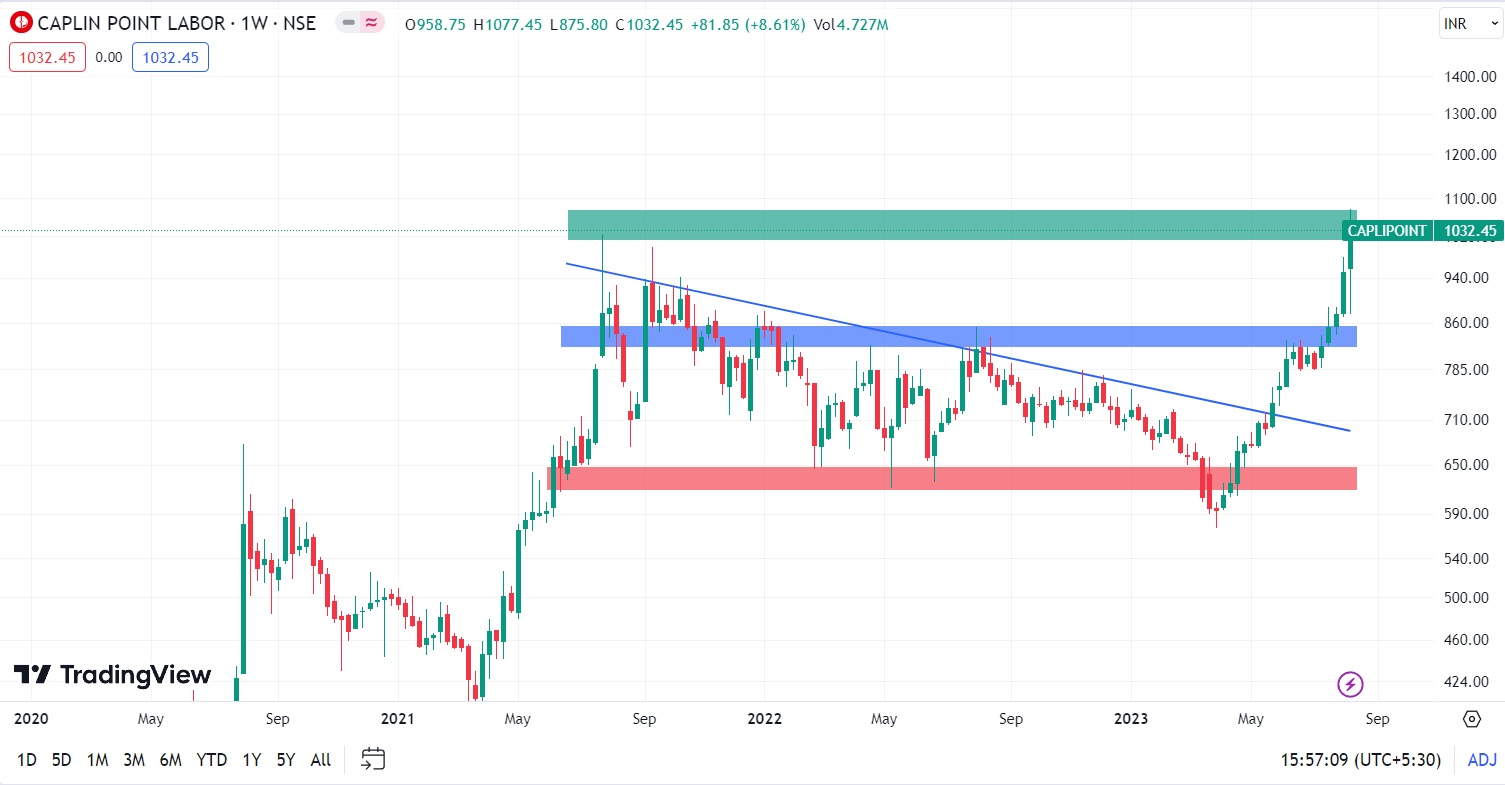
- Stock is in an upward trend on the monthly and weekly chart, ₹860 and ₹1032 are support and resistance zone levels.
- Stock has given a nice break-out around ₹860 and breaking its all time of ₹1025 and making new high of ₹1077.
- One can accumulate this stock at current levels & add on dips in ₹900-₹940 band.
Con-Call (Q1FY2024)
- The company has shown strong growth in revenue and profits, with a notable 26.19% return on capital employed. Cash reserves have risen to INR 770 crores over a decade. Consistently achieving 16.4% growth, the company maintains high gross margins and robust EBITDA, PBT, and PAT figures, highlighting its profitability and financial strength.
- The company is venturing into new regions like LatAm, West Africa, CIS, and Southeast Asia. Caplin Steriles is projected to contribute INR 90-100 crores to this year's income. The company has acquired an API facility in Vizag, set to become operational this year.
- They have introduced their initial four co-labelled products to the market and are awaiting FDA reviews for eight products, with 13 products under stability testing. With the completion of Line 6 and Line 7, the company will possess a comprehensive product portfolio and improved visibility in labeled products and the US market.
- Despite facing challenges such as price pressures and market share erosion within the industry, the company has managed to enhance its market share across a majority of its products. In pursuit of long-term sustainability, the company is committed to upholding a unique business model that sets it apart from competitors.
- Caplin Steriles has achieved a break-even point with a modest profit, despite accounting for all expenses including ANDA filing, R&D costs, and regulatory expenses. Their current focus lies in finalizing the validation of a new high-speed and highly compliant production line acquired from Bosch. This line is expected to substantially decrease turnaround time and enhance productivity.
- The company allocates its funds to scheduled bank deposits, AAA-rated company deposits, and intercorporate bonds, amounting to ₹71 crores in other financial assets. The gross margin for the Central America and LatAm business ranges between 54.5% to 55%, while Steriles EBITDA for the quarter stands at approximately ₹8.5 crores.
- Over the past three years, the company has successfully developed 65 APIs through its research and development (R&D) efforts. The company boasts an impressive history of product approvals and strong R&D capabilities. Despite consistent R&D spending over the last three years, the company faces a significant impact on its bottom line due to high R&D and filing costs.
- Looking ahead, the company anticipates that its R&D expenditure will remain relatively stable in terms of absolute figures. Their focus will be on maintaining operational expenses while sustaining their current R&D investment level. The projected capital expenditure (capex) for the fiscal year 2024 and the first half of fiscal year 2025 is estimated to range between INR 350-360 crores. This allocation will support ongoing initiatives including CSL Phase II and III, the Once project, and the establishment of a new OSD greenfield plant.
Recommendation Rationale
- Experienced Management and Strong Distribution Network:
- With a cumulative experience of over 30 years in the pharmaceutical industry, the management team at Caplin Point Laboratories boasts an unparalleled wealth of expertise. Notably, the contributions of Mr. C.C. Paarthipan and Dr. Sridhar Ganesan have played a pivotal role in propelling the company to its esteemed position today. This leadership, coupled with other talented individuals, has been instrumental in shaping the company into a top-tier player within the industry. In addition to its exceptional leadership, Caplin Point Laboratories has built a formidable distribution network that spans across 26 countries.
- By engaging in direct marketing to pharmacies and wholesalers, the company is pioneering a strategy that bypasses traditional trade channels. Presently, 20% of the company's revenue is generated from direct sales, a testament to the effectiveness of this approach. Furthermore, plans to widen the interface to include 15,000 pharmacies will not only address bottom-of-the-pyramid customers but also facilitate meaningful engagement with healthcare professionals, such as doctors.
- Geographical Expansion and Diversified Product Profile.
- Caplin Point Laboratories is expanding into the US market through its subsidiary, Caplin Steriles USA Inc. The incorporation process is underway, with completion expected in 6-8 months. The company has 7 ANDAs awaiting FDA review for injectables and ophthalmics. With 23 ANDA approvals, including 18 under CSL, they plan to submit 10+ ANDAs next year, spanning various pharmaceutical categories. Their pipeline holds 55+ ANDAs, targeting a $5 billion market in the US. Presently, Caplin Point Laboratories offers a broad portfolio of over 4,000 registered products and 650 formulations across 36 therapeutic segments, showcasing its commitment to diverse healthcare solutions.
- Stable Financial Risk Profile:
- Caplin Point has earmarked a Capex budget of around ₹500-550 Crores for strategic investments. This investment is targeted at bolstering current production capabilities, expanding the product lineup, and achieving backward integration for a major portion of offerings. The funding for this Capex will be entirely sourced from internal accruals, ensuring the Company maintains a net cash positive stance throughout the initiative. Caplin's consistent strong financial performance over the past five quarters positions it favorably for these endeavors.
Valuation
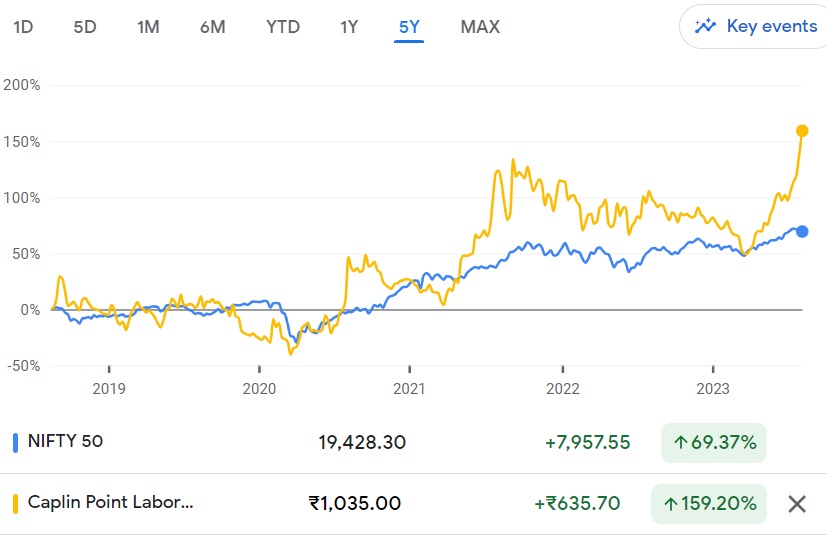
- Caplin Point Laboratories Limited has shown revenue growth of 22% CAGR for FY2019-2023.
- Net Profit has shown revenue growth of 21% CAGR for FY2019-2023.
- The company’s ROE and ROCE are 22% & 26% for FY2023.
- We estimate the company could generate higher revenue and net profit for the following FY 2024, comparable to the prior year, based on the company's present performance in FY 2023.
- To project income for the fiscal years 2024–2028, we used data from the previous five years (2019–2023).
Estimated Income Statement (₹ in crores)
|
|
Mar-24 |
Mar-25 |
Mar-26 |
Mar-27 |
Mar-28 |
|
|
2024-E |
2025-E |
2026-E |
2027-E |
2028-E |
|
Revenue |
1,860.15 |
2,273.23 |
2,779.00 |
3,398.33 |
4,156.85 |
|
COGS |
813.26 |
997.26 |
1,222.89 |
1,499.56 |
1,838.83 |
|
Gross Profit |
1,046.89 |
1,275.98 |
1,556.11 |
1,898.77 |
2,318.02 |
|
Employee Expenses |
165.67 |
203.16 |
249.12 |
305.48 |
374.60 |
|
Other Expenses |
281.29 |
344.94 |
422.98 |
518.68 |
636.02 |
|
EBITDA |
599.92 |
727.88 |
884.01 |
1,074.61 |
1,307.39 |
|
Depreciation |
49.12 |
67.62 |
89.30 |
115.02 |
145.81 |
|
EBIT |
550.81 |
660.26 |
794.71 |
959.59 |
1,161.58 |
|
Financial Cost |
0.95 |
1.14 |
1.37 |
1.66 |
2.00 |
|
PBT Share of Profit in Associate |
549.86 |
659.12 |
793.34 |
957.93 |
1,159.58 |
|
Share of Profit in Associate |
0.10 |
0.12 |
0.14 |
0.17 |
0.21 |
|
PBT |
549.96 |
659.24 |
793.48 |
958.10 |
1,159.78 |
|
Tax expenses |
90.61 |
108.61 |
130.73 |
157.85 |
191.07 |
|
PAT |
459.25 |
550.51 |
662.61 |
800.09 |
968.50 |
- Share :


Post a Comment
|
DISCLAIMER |
This report is only for the information of our customers. Recommendations, opinions, or suggestions are given with the understanding that readers acting on this information assume all risks involved. The information provided herein is not to be construed as an offer to buy or sell securities of any kind. ATS and/or its group companies do not as assume any responsibility or liability resulting from the use of such information.