Copper Trend
Copper Trend for Sep
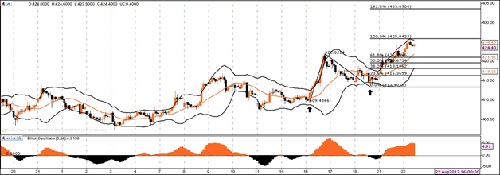
Overall view remains Bullish on Copper for the month of September.
As per the daily swing chart, the formation of a new minor top is seen at the levels of 422. From the lows of 409, the commodity has made a higher low at the level of 413 and made it possible to take firm support at the level of 413.
Start of a new trend from the level of 413 is very well indicated from the chart and further confirmed from the Fibonacci tool.
The short-term resistance area will be from the level of 422-426. If this zone is broken , the commodity is all set to touch the levels of 434. The near term levels are 425-426 and further upside levels of 434 are on charts. Price closing above 426 will confirm that upside levels of 434 are set for the commodity
Elliot oscillator at the level of +4.9 which shows that trend is Bullish, Fibonacci Extention tool states that the next resistance level is at 434, Bollinger band indicating copper is trading at the upper band and has not touched the lower band from past 3 trading days which further confirms the trend.
All the above factors help us to conclude the bullish trend which is set in, will make copper likely to touch 433.
- Share :


Post a Comment
|
DISCLAIMER |
This report is only for the information of our customers. Recommendations, opinions, or suggestions are given with the understanding that readers acting on this information assume all risks involved. The information provided herein is not to be construed as an offer to buy or sell securities of any kind. ATS and/or its group companies do not as assume any responsibility or liability resulting from the use of such information.