Canara Bank Limited Research Report
|
Industry |
Market Price |
Recommendation |
Target |
Time Horizon |
|
Bank |
309.45 |
Buy |
350 |
1-Year |
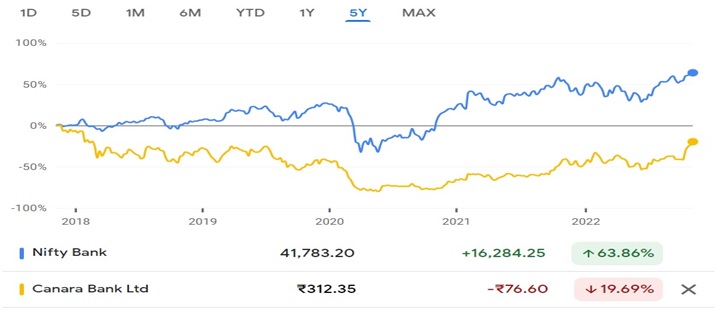
Canara Bank Limited - Q2FY2023 Review
Canara Bank Limited reported net revenue of ₹20,482.35 crores for the quarter ended September 30, 2022, compared to ₹17,336.33 crores for September 30, 2021. Profit After Tax was ₹2,593.49 crores for the quarter ended September 30, 2022, compared to ₹1,100.59 crores during the corresponding quarter of the previous year, respectively.
Canara Bank Limited - Investment Summary
|
CMP (₹) |
309.45 |
|
52 Week H/L |
171.75/315 |
|
Market Cap (crores) |
56,138 |
|
Face Value (₹) |
10.00 |
|
Promoter Holding (%) |
62.93 |
|
Non-Promoter Holding (%) |
36.07 |
|
Total (%) |
100.00 |
|
Book Value |
₹338.76 |
|
EPS TTM |
₹35.04 |
Canara Bank Limited - Overview
-
Canara Bank is a Bengaluru-based PSB that was founded in 1906. The merger of Syndicate Bank and Canara Bank took effect on April 1st, 2020, in accordance with a decree from the Ministry of Finance, GOI.
-
The bank has 9,722 branches and 12,158 ATMs/recyclers as of September 30, 2022.
-
The fourth-largest PSB as of September 30, 2022 is Canara Bank.
Beta: 1.55 |
Alpha: -8.83 |
Risk Reward Ratio: 1.26 |
Margin of Safety: 14% |
Canara Bank Limited - Quarterly Summary
|
Quarterly (INR in crores) |
Sep-22 |
Jun-22 |
Mar-22 |
Dec-21 |
Sep-21 |
|
Interest Income |
20,482.35 |
18,536.89 |
18,226.88 |
17,982.50 |
17,336.33 |
|
Interest Expended |
12,681.08 |
11,395.61 |
10,855.84 |
10,761.37 |
10,791.47 |
|
|
|
|
|
|
|
|
Net Interest Income |
7,801.27 |
7,141.28 |
7,371.04 |
7,221.13 |
6,544.86 |
|
|
|
|
|
|
|
|
Other Income |
6,876.02 |
5,202.38 |
6,291.54 |
4,861.01 |
6,539.67 |
|
Total Income |
14,677.29 |
12,343.66 |
13,662.58 |
12,082.14 |
13,084.53 |
|
|
|
|
|
|
|
|
Employee Cost |
3,259.40 |
3,545.56 |
3,362.24 |
3,102.60 |
3,266.24 |
|
Other Expenses |
4,429.27 |
2,148.13 |
3,734.45 |
3,037.57 |
4,438.65 |
|
Provision and Contingencies |
3,637.73 |
3,688.78 |
3,727.34 |
2,246.08 |
3,360.73 |
|
EBT Before Exceptional Items |
3,350.89 |
2,961.19 |
2,838.55 |
3,695.89 |
2,018.91 |
|
|
|
|
|
|
|
|
Exceptional Items |
- |
- |
- |
1,354.90 |
- |
|
EBT |
3,350.89 |
2,961.19 |
2,838.55 |
2,340.99 |
2,018.91 |
|
|
|
|
|
|
|
|
Tax Expenses |
757.40 |
902.88 |
869.51 |
710.31 |
918.32 |
|
PAT before Minority Interest & Share in Profit/(Loss) of Associates |
2,593.49 |
2,058.31 |
1,969.04 |
1,630.68 |
1,100.59 |
|
|
|
|
|
|
|
|
Minority Interest |
-24.03 |
-13.35 |
-142.39 |
-55.03 |
119.98 |
|
Share in Profit/(Loss) of Associates |
136.09 |
134.81 |
92.15 |
81.44 |
93.84 |
|
Net Profit |
2,705.55 |
2,179.77 |
1,918.80 |
1,657.09 |
1,314.41 |
Business
-
On July 1st, 1906, Canara Bank was established under the name Canara Hindu Permanent Fund Ltd. Ammembal Subba Rao Pai established the bank.
-
The bank's name was changed from Canara Hindu Permanent Fund Ltd to Canara Bank Ltd in the year 1910.
-
Along with 14 other significant banks nationwide, the Bank was nationalized on July 19, 1969.
-
Laksmi Commercial Bank Ltd. merged with the Bank in the year 1984.
-
The Bank entered into memorandums of understanding (MoUs) with worldwide majors HSBC (Asia Pacific) Holding and Robeco Groep N.V. to commission two joint ventures in the insurance and asset management sectors, respectively.
-
As of December 31, 2018, the bank held the top spot among all PSBs in the Digital Score Card published by the Ministry of Electronics and Information Technology (MeitY).
-
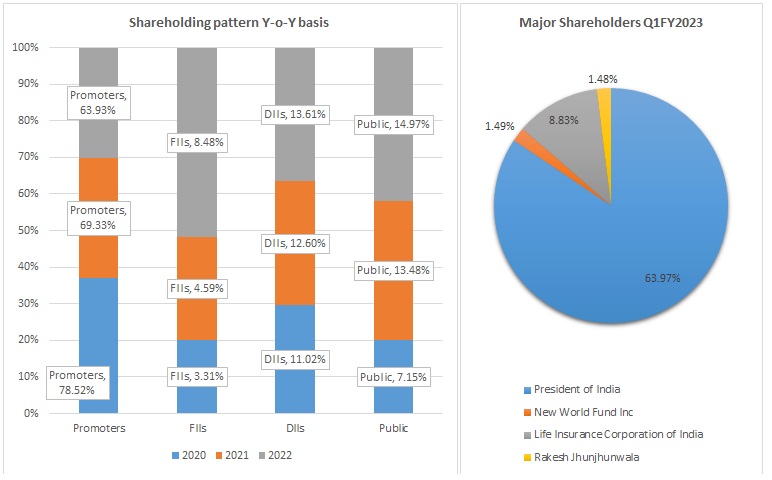
GOI is the majority shareholder holding a 62.93% stake in the bank followed by LIC of India holding 8.83% as on September 30, 2022.
-
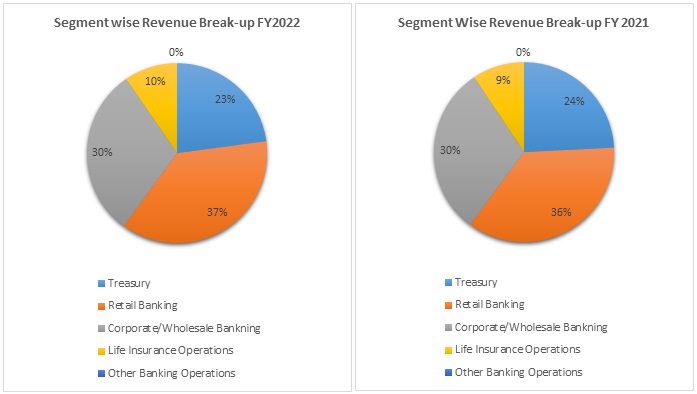
The business segment of Canara Bank Limited is as follows:
-
Corporate/ Wholesale Banking
-
Retail Banking
-
Treasury
-
Life Insurance Operations
-
Other Banking Operations
-
-
Out of the total revenue, 30% has been generated from Corporate/Wholesale banking, 37% from Retail Banking, 23% from Treasury, 10% from Life Insurance Operations, and 0% from Other Banking Operations in FY 2022 compared to 30%, 36%, 24%, 9%, and 0% in FY 2021, respectively.
-
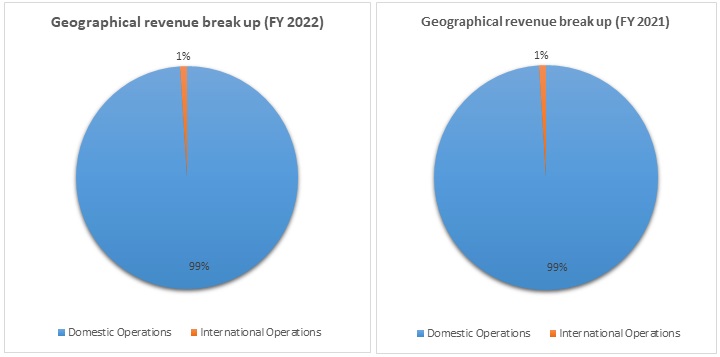
Out of the total revenue, the contribution from domestic operations was 99% and 1% from international operations in FY 2022 compared to 99% and 1% in FY 2021, respectively.
Canara Bank Limited - SWOT ANALYSIS
-
Strength
-
Fourth Largest Public Sector Bank
-
Major Ownership by the Government of India
-
Established Branch Network
-
Improving Profitability.
-
-
Weakness
-
Poor Customer Service.
-
Weak Customer Base.
-
Moderate Asset Quality.
-
-
Opportunity
-
Investment in digital technology.
-
Improving asset qualities of PSU Banks.
-
Increasing capital expenditure by the companies.
-
-
Threat
-
Increasing competition in the financial sector.
-
Concentric Geographical Networking
-
Ongoing uneven circumstances globally (e.g., Inflation).
-
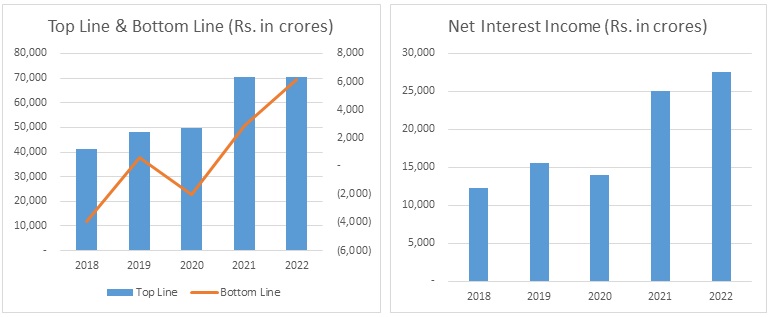
Canara Bank Limited - Revenue Trend
Canara Bank Limited - Ratio Analysis
|
|
Mar-19 |
Mar-20 |
Mar-21 |
Mar-22 |
|
Net Interest Income |
2.19% |
1.88% |
2.12% |
2.19% |
|
Gross NPA |
8.83% |
8.21% |
8.93% |
7.51% |
|
Net NPA |
5.37% |
4.23% |
3.82% |
2.65% |
|
Provision Coverage Ratio |
63.18% |
75.86% |
79.68% |
84.17% |
|
Capital Adequacy Ratio |
13.42% |
13.30% |
13.18% |
14.90% |
|
CASA Ratio |
29.17% |
31.36% |
32.72% |
33.92% |
|
ROA |
0.08% |
(0.26%) |
0.24% |
0.48% |
|
ROE |
1.92% |
(5.69%) |
5.34% |
9.96% |
|
Cost to Income Ratio |
43.16% |
45.10% |
48.87% |
48.19% |
Canara Bank Limited - Financial Overview
Canara Bank Limited - Profit and Loss Statement (₹ in crores)
|
|
Mar-18 |
Mar-19 |
Mar-20 |
Mar-21 |
Mar-22 |
|
Interest income |
41,345.32 |
47,951.10 |
49,758.75 |
70,253.27 |
70,613.79 |
|
Interest Expended |
29,112.90 |
32,338.69 |
35,817.19 |
45,182.50 |
43,035.47 |
|
|
|
|
|
|
|
|
Net Income |
12,232.42 |
15,612.41 |
13,941.57 |
25,070.77 |
27,578.32 |
|
|
|
|
|
|
|
|
Other income |
7,398.00 |
9,907.16 |
11,799.40 |
23,086.18 |
23,643.10 |
|
Total income |
19,630.42 |
25,519.57 |
25,740.97 |
48,156.95 |
51,221.41 |
|
|
|
|
|
|
|
|
Other expenses |
9,837.81 |
14,565.89 |
16,066.97 |
28,284.90 |
27,923.70 |
|
Provision and Contingencies |
13,879.93 |
10,406.53 |
11,696.51 |
17,170.07 |
17,502.62 |
|
PAT before Share in Profit/(Loss) of Associates & Minority Interest |
-4,087.32 |
547.15 |
-2,022.50 |
2,701.98 |
5,795.10 |
|
|
|
|
|
|
|
|
Share of Minority Interest |
-78.85 |
-94.20 |
-65.42 |
-65.96 |
-33.60 |
|
Share in Profit/(Loss) of Associates |
214.78 |
148.91 |
101.50 |
254.58 |
363.33 |
|
Net Profit |
-3,951.40 |
601.85 |
-1,986.43 |
2,890.60 |
6,124.82 |
|
|
|
|
|
|
|
|
EPS |
|
|
|
|
|
|
Basic |
-65.94 |
8.18 |
-23.55 |
19.11 |
35.05 |
|
Diluted |
-65.94 |
8.18 |
-23.55 |
19.11 |
35.05 |
|
|
|
|
|
|
|
|
Number of shares |
|
|
|
|
|
|
Basic |
59.92 |
73.62 |
84.35 |
151.23 |
174.77 |
|
Diluted |
59.92 |
73.62 |
84.35 |
151.23 |
174.77 |
|
|
|
|
|
|
|
Canara Bank Limited - Cash Flow Statement (₹ in crores)
|
|
Mar-18 |
Mar-19 |
Mar-20 |
Mar-21 |
Mar-22 |
|
Net Profit Before Tax |
-6,270.01 |
-2,057.55 |
-1,477.43 |
4,070.17 |
9,474.74 |
|
Net Cash from Operating Activities |
-552.94 |
18,236.72 |
-5,289.14 |
59,117.66 |
918.99 |
|
Net Cash Used for Investing Activities |
2,864.87 |
-730.40 |
-410.81 |
-1,029.41 |
-1,255.88 |
|
Net Cash From (Used For) Financing Activities |
3,413.08 |
-1,184.59 |
7,792.27 |
290.08 |
4,035.45 |
|
Net Increase in Cash and Cash Equivalents |
-8,742.78 |
16,306.64 |
2,058.58 |
58,291.27 |
3,525.06 |
|
Cash And Cash Equivalents at The Beginning of the Year |
58,967.38 |
50,224.60 |
66,531.24 |
1,20,575.10 |
1,78,866.37 |
|
Cash And Cash Equivalents at The End of the Year |
50,224.60 |
66,531.24 |
68,589.82 |
1,78,866.37 |
1,82,391.43 |
Canara Bank Limited - Balance Sheet (₹ in crores)
|
|
Mar-18 |
Mar-19 |
Mar-20 |
Mar-21 |
Mar-22 |
|
CAPITAL AND LIABILITIES |
|
|
|
|
|
|
Capital |
733.24 |
753.24 |
1,030.23 |
1,646.74 |
1,814.13 |
|
Reserve and Surplus |
36,164.45 |
36,935.99 |
40,175.72 |
60,762.85 |
68,147.19 |
|
Minority Interest |
521.80 |
667.87 |
730.10 |
793.38 |
824.69 |
|
Deposits |
5,24,846.98 |
5,99,123.02 |
6,25,408.32 |
10,10,985.02 |
10,86,340.95 |
|
Borrowings |
38,909.50 |
41,042.64 |
42,761.77 |
50,012.80 |
46,284.96 |
|
Other Liabilities and Provisions |
30,259.50 |
33,260.04 |
31,334.13 |
55,338.81 |
54,251.61 |
|
Total |
6,31,435.47 |
7,11,782.81 |
7,41,440.27 |
11,79,539.60 |
12,57,663.54 |
|
|
|
|
|
|
|
|
ASSETS |
|
|
|
|
|
|
Cash and Balances with Reserve Bank of India |
22,102.42 |
29,921.43 |
22,572.96 |
43,115.94 |
51,637.08 |
|
Balances with Banks and Money at Call and Short Notice |
28,122.19 |
36,609.81 |
46,016.86 |
1,35,750.43 |
1,30,754.35 |
|
Investments |
1,57,443.56 |
1,68,678.05 |
1,92,645.37 |
2,86,191.25 |
3,11,347.24 |
|
Advances |
3,82,074.58 |
4,28,114.77 |
4,32,403.38 |
6,39,286.54 |
7,03,864.05 |
|
Fixed Assets |
8,335.30 |
8,432.78 |
8,323.35 |
11,271.17 |
11,449.70 |
|
Other Assets |
33,357.43 |
40,025.97 |
39,478.35 |
63,924.26 |
48,611.12 |
|
Total |
6,31,435.47 |
7,11,782.81 |
7,41,440.27 |
11,79,539.60 |
12,57,663.54 |
Industry Overview
-
The combined net profit of all public sector banks (PSBs) climbed by 32% to Rs 40,991 crore in the first half of FY23.
-
The government's efforts to eliminate bad loans, according to Finance Minister Nirmala Sitharaman, are paying off, as seen by the fact that 12 public sector banks reported a 50% increase in total net profit for the second quarter ended in September, coming in at Rs 25,685 crore.
-
Asset quality is another crucial indicator that has significantly improved. Due to little slippages from the restructuring pool and a low SMA (special mention accounts) pool relative to historical levels, the SMA pool continues to be low. The asset quality has significantly improved, as evidenced by the fact that gross slippages have significantly decreased from peak levels and net slippages are negative.
-
When compared to the past, the profits prognosis for PSU banks is still on the rise, driven by gains in all key metrics, including margins, operating profitability, operating expenses, good liquidity, slippages, upgrades, and recoveries. In H1:2022-23, domestic economic activity remained robust. The demand for contact-intensive activities, discretionary spending, and investment activity were all fueled by consumer confidence and company optimism. Looking ahead, strong progress with Kharif sowing, sufficient reservoir levels, the government's continued focus on capital expenditures, increased capacity utilization in manufacturing, a pick-up in non-food credit, and a decline in COVID-19 infections should support overall demand and activity in H2. However, there are adverse risks to the domestic outlook due to the global economic slowdown, tighter financial markets, and geopolitical tensions (Monetary Policy September 2022).
-
Bank credit demand has increased in tandem with economic growth, even as lending and deposit rates have begun to rise. The foreign currency market has seen an orderly adjustment of the INR, with a weakening tendency due to the general strength of the US dollar. Going forward, the RBI will remain attentive, flexible, and nimble in its liquidity management activities, employing all available tools to reduce the effects of global financial market volatility on domestic financial markets (Monetary Policy September 2022).
-
The risks to the prospects for the global economy are predominantly negative as monetary authorities tighten monetary policy aggressively to combat excessive inflation. Global financial markets are experiencing significant volatility because of the ongoing conflict and the rate of monetary tightening, which is also increasing demand for safe-haven assets like the US dollar. These changes are having significant negative spillover effects on developing market economies and pose significant downside risks to those nations' economic prospects (Monetary Policy September 2022).
-
In the banking industry, private sector banks continue to outperform their counterparts in the public sector in terms of loan growth, both wholesale and retail.
-
Asset quality in the banking sector has increased during the past year, helped by an uptick in economic activity. Even if concerns about restructured credit persist, bad loans decreased by around 185 basis points to 5.7% of all loans.
-
Non-performing assets (NPAs) are on a relatively low level on banks' balance sheets, drop for both wholesale and retail loans, and have enough capital buffers. In a dynamic climate marked by significant uncertainty, the drop in risk-weighted assets shows that banks are still cautious about the risk profile of borrowers.
-
The Morgan Stanley study stated that "strong balance sheets, waning economic concerns, and better capacity utilization lay the scenario for a Capex up-cycle in FY24-FY25, which might fuel a second leg of rerating at Indian banks."
-
S&P Global Ratings projected that bad loans in India’s banking sector will decline to 5% - 5.5% of gross loans by 31 March 2024. Credit costs are predicted to settle around 1.5% for FY23 and then normalize further to 1.3%, bringing them comparable to those of other emerging economies and the 15-year average for India.
-
According to rating agency ICRA, bank bad loan ratios are anticipated to further decrease to 5.2–5.3% by 31 March 2023 due to a lower slippage rate and stronger credit growth.
Canara Bank Limited - Concall Overview (Q2FY2023)
-
The bank predicts that growth will remain strong and potentially reach double digits in FY23, above the original projection of 8%.
-
The management is confident that the current capital, coupled with deposits and profits, will cover future growth potential.
-
Margin improvement is likely to occur in the upcoming quarter because management is confident in meeting the NIM forecast of 2.9% for FY23. Any available extra spread above this level will be distributed to the depositors.
-
Sequentially, Treasury income has decreased, but the impact was minimal.
-
Cash recoveries totaled ₹18.76 billion, and the bank received INR12.05 in cash recovery from accounts that were written down.
-
In FY23, the bank hopes to reduce the GNPA/NNPA to less than 6%/2%.
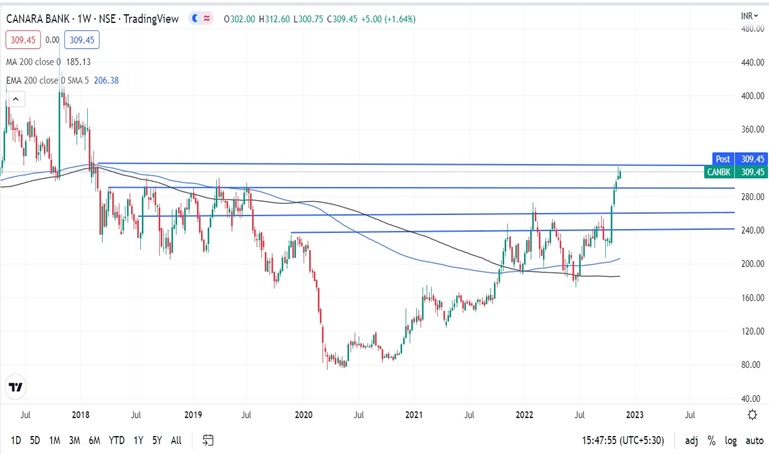
Canara Bank Limited - Technical Analysis
-
Stock is trading above EMA 200 and MA 200 indicators, with a support level of ₹260 and a resistance level of ₹315.
-
Share is trading in an upward trend on daily, weekly, and monthly charts.
-
One can accumulate this stock at current levels.
Canara Bank Limited - Peers Comparison
|
|
FY-2022 |
|||
|
|
GNPA |
NPA |
ROA |
ROE |
|
State Bank of India Limited |
4% |
1.02% |
0.56% |
12.53% |
|
Bank of Baroda Limited |
7% |
1.72% |
0.58% |
8.54% |
|
Canara Bank Limited |
7.51% |
2.65% |
0.48% |
9.96% |
Canara Bank Limited - Recommendation Rationale
-
Bank has a well-diversified distribution network in India. It also has three international branches in New York, London, and Dubai.
-
Canara Bank has received frequent capital infusions from the Government of India (GOI), which are likely to continue. GOI still has a majority stakes in the bank.
-
In Q2FY2023, the bank’s revenue and net profit increased by 18.14% & 135%. Net Profit has been consistently improving from last five quarters.
-
ROA and ROE are 0.79% and 18.86% for Q2FY2023.
-
Overall asset quality of the bank has been moderate. GNPA and NPA decline from 8.42% & 3.21% to 6.37% and 2.19%. The Provision Coverage Ratio has improved from 82.44% to 85.56%.
-
Bank’s slippages ratio has reduced to 0.35% in Q1FY 2023 compared to 1.04% in Q1FY2022.
-
DIIs and FIIs have increased their shareholding to 15.35% & 8.44% in Q2FY2023 from 13.82% & 7.97% in Q1FY2023.
-
During FY22, Canara Bank raised equity capital through QIP totaling 2,500 crores. In addition, the bank issued Tier-II and AT1 bonds during FY22, raising a total of $6,500 crores. Additionally, the bank raised $2,000 crores worth of AT1 bonds in Q2FY23, which will further strengthen the bank’s capital position. The bank’s total Capital Adequacy ratio stood at 16.51% in Q2FY2023 as compared to 14.37% in Q2FY2022.
Valuation
-
The Bank’s Net Interest Income has grown at a CAGR of 23 % from FY 2018-2022.
-
The Bank’s Net Profit has grown from (₹3,951.40) in FY 2018 to ₹6,124.82 in FY2022.
-
The Bank’s return on average net worth has improved from 1.92% to 9.96% during FY 2019–22.
-
Return on Assets has improved from 0.08% to 0.48% from FY 2019-22.
-
Asset quality, net profit, and Net Interest Income improved in Q2FY2023 and management expects the margin to improve further.
-
We anticipate the company could generate higher Net Interest income for the following FY 2023, comparable to the prior year, based on the company's present performance in FY 2022.
-
We used data from the last five years (2018-2022) to anticipate revenue for the fiscal years 2023–2027.
Canara Bank Limited - Estimated Income Statement (₹ in crores)
|
|
Mar-23 |
Mar-24 |
Mar-25 |
Mar-26 |
Mar-27 |
|
|
2023-E |
2024-E |
2025-E |
2026-E |
2027-E |
|
Interest income |
77,675 |
85,443 |
93,987 |
1,03,386 |
1,13,724 |
|
Interest Expended |
47,453 |
52,324 |
57,694 |
63,616 |
70,146 |
|
Net Interest Income |
30,222 |
33,119 |
36,293 |
39,769 |
43,578 |
|
|
|
|
|
|
|
|
Other income |
26,007 |
28,608 |
31,469 |
34,616 |
38,077 |
|
Total income |
56,230 |
61,727 |
67,762 |
74,385 |
81,656 |
|
|
|
|
|
|
|
|
Other expenses |
31,068 |
34,174 |
37,592 |
41,351 |
45,486 |
|
Provision and Contingencies |
19,163 |
21,079 |
23,187 |
25,506 |
28,056 |
|
PAT |
5,999 |
6,474 |
6,983 |
7,529 |
8,113 |
-
We initiate coverage on Canara Bank Limited with a “Buy” and a 1-year Target Price of ₹350.
Disclaimer: This report is only for the information of our customer's Recommendations, opinions, or suggestions are given with the understanding that readers acting on this information assume all risks involved. The information provided herein is not to be construed as an offer to buy or sell securities of any kind.
- Share :


Post a Comment
|
DISCLAIMER |
This report is only for the information of our customers. Recommendations, opinions, or suggestions are given with the understanding that readers acting on this information assume all risks involved. The information provided herein is not to be construed as an offer to buy or sell securities of any kind. ATS and/or its group companies do not as assume any responsibility or liability resulting from the use of such information.