Bank of Baroda Limited Research Report
|
Industry |
Market Price |
Recommendation |
Target |
Time Horizon |
|
Bank |
132.20 |
Buy |
166 |
1-Year |
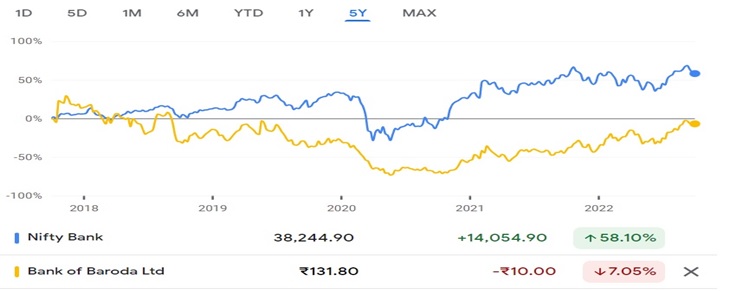
Bank of Baroda - Q1 FY 2023 Review
Bank of Baroda Limited reported net revenue of ₹19,984.39 crores for the quarter ended June 30, 2022, compared to ₹18,025.78 crores for June 30, 2021. Profit After Tax was ₹1,943.90 crores for the quarter ended June 30, 2022, compared to ₹1,186.54 crores during the corresponding quarter of the previous year, respectively.
Bank of Baroda - Investment Summary
|
CMP (₹) |
132.20 |
|
52 Week H/L |
77.05/143.45 |
|
Market Cap (crores) |
68,365 |
|
Face Value (₹) |
2.00 |
|
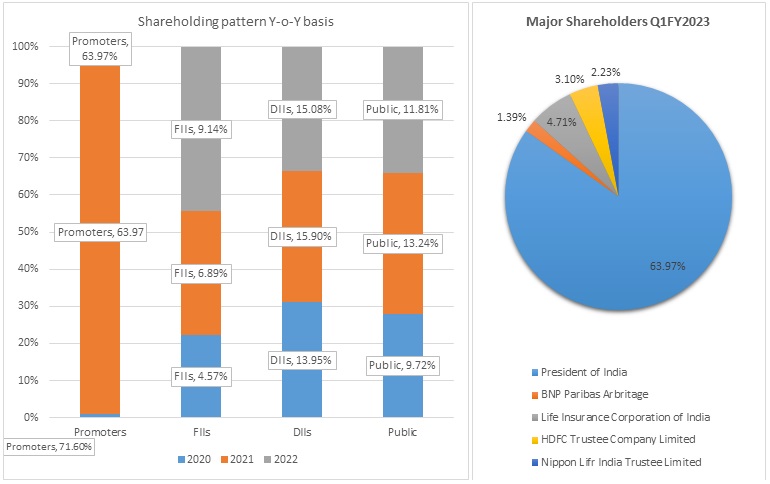
Promoter Holding (%) |
63.97 |
|
Non-Promoter Holding (%) |
36.03 |
|
Total (%) |
100.00 |
|
Book Value |
₹177.43 |
|
EPS TTM |
₹15.18 |
Bank of Baroda - Overview
-
Services offered by the Bank of Baroda include Personal banking, corporate banking, international banking, small and medium business (SME) banking, rural banking, non-resident Indian (NRI) services, and treasury services.
-
The bank has 8,204 branches, 9,825 ATMs, 1650 recyclers, and 79,176 employees as of June 30, 2022.
-
Through the issuance of infrastructure and affordable housing bonds, the Bank of Baroda raised Rs 1000 crore. These bonds were distributed on August 17, 2022.
Beta: 1.17 |
Alpha: -10.2 |
Risk Reward Ratio: 1.44 |
Margin of Safety: 20% |
Bank of Baroda - Quarterly Summary
|
Quarterly (INR in crores) |
Jun-22 |
Mar-22 |
Dec-21 |
Sep-21 |
Jun-21 |
|
Interest Income |
19,984 |
19,097 |
18,722 |
17,541 |
18,026 |
|
Interest Expended |
10,495.65 |
9,955.71 |
9,800.12 |
9,505.39 |
9,554.25 |
|
|
|
|
|
|
|
|
Net Interest Income |
9,489 |
9,141 |
8,922 |
8,036 |
8,472 |
|
|
|
|
|
|
|
|
Other Income |
1,592.37 |
3,373.29 |
3,351.37 |
4,457.87 |
3,212.2 |
|
Total Income |
11,081 |
12,515 |
12,273 |
12,493 |
11,684 |
|
|
|
|
|
|
|
|
Employee Cost |
3,266.89 |
2,907.35 |
3,252.62 |
3,278.71 |
3,205.15 |
|
Other Expenses |
3,531.47 |
3,282.37 |
3,039.76 |
3,382.18 |
2,490.66 |
|
Provision and Contingencies |
1,411.26 |
4,314.98 |
2,688.2 |
2,737.34 |
4,377.1 |
|
EBT |
2,871.49 |
2,010.05 |
3,292.29 |
3,095.14 |
1,610.82 |
|
|
|
|
|
|
|
|
Tax Expenses |
732.1 |
24.41 |
844.45 |
900.09 |
441.62 |
|
PAT before Minority Interest & Share in Profit/(Loss) of Associates |
2,139.39 |
1,985.64 |
2,447.84 |
2,195.05 |
1,169.20 |
|
|
|
|
|
|
|
|
Minority Interest |
2.17 |
-21.04 |
-24.41 |
-17.43 |
-20.41 |
|
Share in Profit/(Loss) of Associates |
-197.66 |
164.45 |
40.32 |
-9.77 |
37.75 |
|
Net Profit |
1,943.90 |
2,129.05 |
2,463.75 |
2,167.85 |
1,186.54 |
Business
-
Bank of Baroda was incorporated as a private bank on July 20, 1908. The bank was established with a paid-up capital of ₹ 1 million and was founded by Maharaja Sayajirao III of Baroda.
-
The Bank opened its first-ever branch in Ahmedabad in 1910 and opened its first branch in Mumbai City in 1919.
-
The bank, along with 13 other major Indian commercial banks, was nationalized by the Indian government on July 19, 1969, and is now considered a profitable public sector operation.
-
The Bank established its first international office in Mombasa, Kenya, in 1953.
-
With an Initial Public Offering in December 1996, the Bank debuted on the capital market.
-
At its meeting on September 27, 2014, the Board of Directors of Bank of Baroda gave its principal approval for splitting one equity share with a face value of ₹10 into five equity shares with a face value of ₹2.
-
The Reserve Bank of India fined the bank Rs 5 crore, according to a statement released by Bank of Baroda on July 25, 2016. The RBI conducted the inquiry and noted the shortcomings that were indicative of flaws and failures in internal control procedures concerning certain AML rules, such as monitoring of transactions and timely reporting to FIU, as well as awarding UCIC to clients. In a statement, the Bank of Baroda stated that the bank has put in place a thorough corrective action plan to enhance internal controls and guarantee that such occurrences don't happen again.
-
As a first move toward consolidating public sector banks, the government announced the first three-way merger of Vijaya Bank, Dena Bank, and Bank of Baroda during FY19. The merged bank, which began operations on April 1, 2019, is one of the biggest PSBs in India in terms of scale, raising the institution's systemic relevance.
The business segment of the Bank of Baroda is as follows:
-
Corporate/ Wholesale Banking:
-
The lending operations of borrowers with exposure exceeding 7.50 crores are included in the corporate/wholesale banking section.
-
-
Retail Banking:
-
Borrower accounts with exposure up to 7.50 crores are included in the retail banking segment.
-
-
Treasury:
-
The whole investment portfolio, as well as trading in derivative contracts and foreign currency contracts, are all part of the Treasury Segment.
-
The fees, profits, and losses from trading activities and interest income from the investment portfolio make up the majority of the treasury segment's revenue.
-
-
Other Banking Operations:
-
Banking transactions that fall outside the aforementioned segments are included in this category.
-
-
-
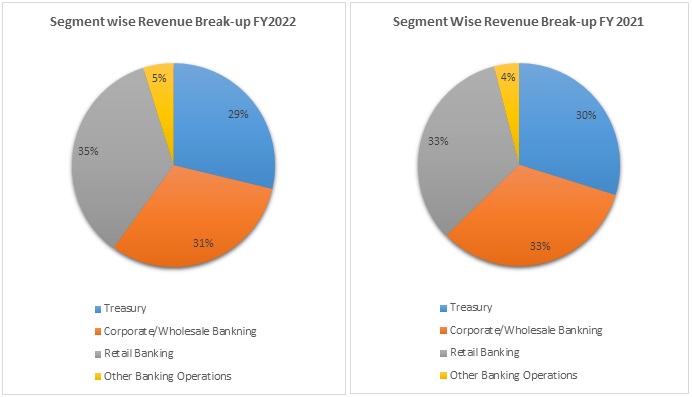
Out of the total revenue, 31% has been generated from Corporate/Wholesale banking, 35% from Retail Banking, 29% from Treasury, 4%, and 5% from Other Banking Operations in FY 2022 compared to 33%, 33%, 30%, and 4% in FY 2021, respectively.
-
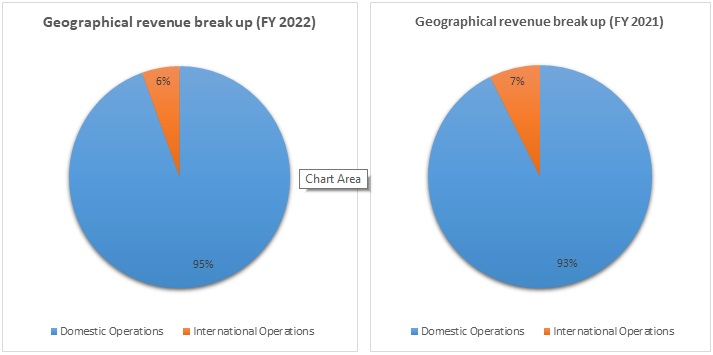
Out of the total revenue, the contribution from domestic operations was 95% and 6% from international operations in FY 2022 compared to 93% and 7% in FY 2021, respectively.
Bank of Baroda - SWOT ANALYSIS
-
Strength
-
Strong customer base.
-
Improving profit from last two years
-
Diversified branch network.
-
Government support.
-
-
Weakness
-
Moderate asset quality.
-
Weak internal control.
-
Exposure to forex fraud in the past.
-
-
Opportunity
-
Investment in digital technology.
-
Improving asset qualities of PSU Banks.
-
Increasing capital expenditure by the companies.
-
-
Threat
-
Increasing competition in the financial sector.
-
Ongoing uneven circumstances globally (e.g., Inflation).
-
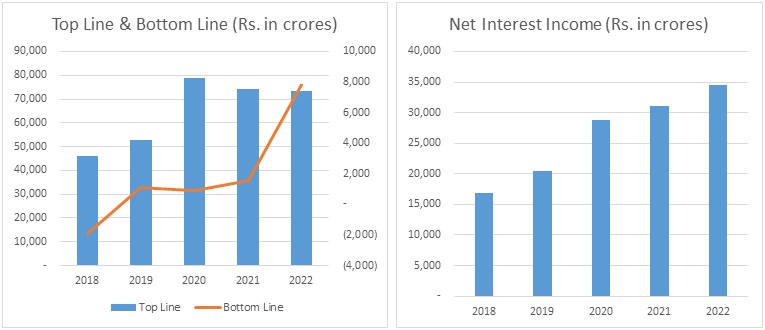
Bank of Baroda - Revenue Trend
Bank of Baroda - Ratio Analysis
|
|
Mar-19 |
Mar-20 |
Mar-21 |
Mar-22 |
|
Net Interest Income |
2.60% |
2.86% |
2.59% |
2.72% |
|
Gross NPA |
10.00% |
9.00% |
9.00% |
7.00% |
|
Net NPA |
3.33% |
3.13% |
3.09% |
1.72% |
|
Provision Coverage Ratio |
67.21% |
78.68% |
88.80% |
88.71% |
|
Capital Adequacy Ratio |
13.42% |
13.30% |
15.74% |
16.19% |
|
CASA Ratio |
34.60% |
35.02% |
39.80% |
41.14% |
|
ROA |
0.14% |
0.09% |
0.13% |
0.62% |
|
ROE |
2.28% |
1.47% |
1.95% |
9.01% |
|
Cost to Income Ratio |
44.08% |
29.86% |
44.78% |
51.16% |
Bank of Baroda - Financial Overview
Bank of Baroda - Profit and Loss Statement (₹ in crores)
|
|
Mar-18 |
Mar-19 |
Mar-20 |
Mar-21 |
Mar-22 |
|
Interest income |
46,056.42 |
52,906.25 |
78,894.70 |
74,313.98 |
73,385.46 |
|
Interest Expended |
29,160.48 |
32,505.72 |
50,039.89 |
43,201.18 |
38,815.47 |
|
|
|
|
|
|
|
|
Net Income |
16,895.93 |
20,400.53 |
28,854.81 |
31,112.80 |
34,569.98 |
|
|
|
|
|
|
|
|
Other income |
7,992.21 |
7,887.05 |
12,191.33 |
15,253.65 |
14,394.73 |
|
Total income |
24,888.14 |
28,287.58 |
41,046.14 |
46,366.45 |
48,964.71 |
|
|
|
|
|
|
|
|
Other expenses |
11,326.58 |
12,768.97 |
20,576.28 |
23,117.47 |
24,838.79 |
|
Provision and Contingencies |
15,473.62 |
14,431.54 |
19,527.67 |
21,795.08 |
16,425.69 |
|
PAT before Share in Profit/(Loss) of Associates & Minority Interest |
-1,912.06 |
1,087.07 |
942.18 |
1,453.90 |
7,700.23 |
|
|
|
|
|
|
|
|
Share of Minority Interest |
-51.29 |
-66.17 |
-52.96 |
-72.63 |
-83.29 |
|
Share in Profit/(Loss) of Associates |
76.24 |
79.19 |
38.53 |
166.40 |
232.75 |
|
Net Profit |
-1,887.11 |
1,100.10 |
927.75 |
1,547.67 |
7,849.69 |
|
|
|
|
|
|
|
|
EPS |
|
|
|
|
|
|
|
|
|
|
|
|
|
Basic |
-8.17 |
4.16 |
2.32 |
3.32 |
15.18 |
|
Diluted |
-8.17 |
3.58 |
2.32 |
3.32 |
15.18 |
|
|
|
|
|
|
|
|
Number of shares |
|
|
|
|
|
|
Basic |
230.88 |
264.55 |
400.73 |
466.28 |
517.14 |
|
Diluted |
230.88 |
307.05 |
400.73 |
466.28 |
517.14 |
Bank of Baroda - Cash Flow Statement (₹ in crores)
|
|
Mar-18 |
Mar-19 |
Mar-20 |
Mar-21 |
Mar-22 |
|
Net Profit Before Tax |
-2,080.72 |
1,537.62 |
-1,248.34 |
6,466.94 |
10,157.76 |
|
Net Cash from Operating Activities |
-59,691.70 |
-1,449.07 |
1,519.33 |
-887.05 |
6,531.93 |
|
Net Cash Used for Investing Activities |
-413.63 |
-2,537.37 |
-139.00 |
-471.39 |
-3,645.07 |
|
Net Cash From (Used For) Financing Activities |
3,413.08 |
4,448.53 |
14,728.67 |
-985.50 |
-1,319.39 |
|
Net Increase in Cash and Cash Equivalents |
-56,692.25 |
462.09 |
16,109.01 |
-2,343.94 |
1,567.47 |
|
Cash And Cash Equivalents at The Beginning of the Year |
1,54,115.00 |
97,422.75 |
97,884.84 |
1,31,005.08 |
1,28,661.14 |
|
Cash And Cash Equivalents at The End of the Year |
97,422.75 |
97,884.84 |
1,31,005.08 |
1,28,661.14 |
1,30,228.61 |
Bank of Baroda - Balance Sheet (₹ in crores)
|
|
Mar-18 |
Mar-19 |
Mar-20 |
Mar-21 |
Mar-22 |
|
CAPITAL AND LIABILITIES: |
|
|
|
|
|
|
Capital |
530.36 |
530.36 |
925.37 |
1,035.53 |
1,035.53 |
|
Share Application Money Pending Allotment |
- |
5,042.00 |
- |
- |
- |
|
Reserve and Surplus |
46,035.87 |
49,423.76 |
75,178.92 |
81,354.05 |
90,832.55 |
|
Minority Interest |
272.52 |
341.36 |
386.17 |
436.20 |
757.78 |
|
Deposits |
6,07,451.36 |
6,65,588.69 |
9,73,228.15 |
9,95,909.81 |
10,75,804.44 |
|
Borrowings |
64,859.82 |
68,867.53 |
95,752.70 |
71,263.34 |
1,09,526.11 |
|
Other Liabilities and Provisions |
28,654.98 |
29,878.24 |
54,470.82 |
52,676.86 |
62,180.68 |
|
Total |
7,47,804.92 |
8,19,671.94 |
11,99,942.14 |
12,02,675.79 |
13,40,137.09 |
|
|
|
|
|
|
|
|
ASSETS: |
|
|
|
|
|
|
Cash and Balances with Reserve Bank of India |
24,034.99 |
28,225.35 |
34,244.78 |
40,153.72 |
56,774.94 |
|
Balances with Banks and Money at Call and Short Notice |
73,387.76 |
69,659.49 |
96,760.29 |
88,507.41 |
73,453.66 |
|
Investments |
1,75,137.23 |
1,95,716.24 |
2,89,726.72 |
2,81,859.00 |
3,47,587.10 |
|
Advances |
4,37,941.26 |
4,84,214.81 |
7,06,539.73 |
7,23,242.25 |
7,97,280.94 |
|
Fixed Assets |
5,532.28 |
7,143.71 |
9,043.78 |
8,216.94 |
10,188.06 |
|
Other Assets |
31,771.40 |
34,488.44 |
63,402.92 |
60,472.56 |
53,941.62 |
|
Goodwill on Consolidation |
- |
223.91 |
223.91 |
223.91 |
910.78 |
|
Total |
7,47,804.92 |
8,19,671.94 |
11,99,942.14 |
12,02,675.79 |
13,40,137.09 |
Bank of Baroda - Industry Overview
-
The NPA ratio for public sector banks decreased from 9.4% in June 2021 to 7.2% in June 2022, while it decreased from 4.2% to 3.1% in the same month for private banks.
-
Public sector banks recorded a cumulative year-over-year profit rise of 12.5% in the quarter ending in June 2022 at Rs. 16,205 crores. The majority of PSU banks have seen significant loan growth traction.
-
Asset quality is another crucial indicator that has significantly improved. Due to little slippages from the restructuring pool and a low SMA (special mention accounts) pool relative to historical levels, the SMA pool continues to be low. The asset quality has significantly improved, as evidenced by the fact that gross slippages have significantly decreased from peak levels and net slippages are negative.
-
When compared to the past, the profits prognosis for PSU banks is still on the rise, driven by gains in all key metrics, including margins, operating profitability, operating expenses, good liquidity, slippages, upgrades, and recoveries. In H1:2022-23, domestic economic activity remained robust. The demand for contact-intensive activities, discretionary spending, and investment activity were all fueled by consumer confidence and company optimism. Looking ahead, strong progress with Kharif sowing, sufficient reservoir levels, the government's continued focus on capital expenditures, increased capacity utilization in manufacturing, a pick-up in non-food credit, and a decline in COVID-19 infections should support overall demand and activity in H2. However, there are adverse risks to the domestic outlook due to the global economic slowdown, tighter financial markets, and geopolitical tensions (Monetary Policy September 2022).
-
Bank credit demand has increased in tandem with economic growth, even as lending and deposit rates have begun to rise. The foreign currency market has seen an orderly adjustment of the INR, with a weakening tendency due to the general strength of the US dollar. Going forward, the RBI will remain attentive, flexible, and nimble in its liquidity management activities, employing all available tools to reduce the effects of global financial market volatility on domestic financial markets (Monetary Policy September 2022).
-
Early in June 2022, yearly growth in bank lending by scheduled commercial banks (SCBs) reached 13.1% as the Indian economy struggled to recover from pandemic waves. The catalyst has been wholesale credit, which changed its decreasing trend from a year ago to one of double-digit growth. At the same time, retail credit growth remained healthy.
-
The risks to the prospects for the global economy are predominantly negative as monetary authorities tighten monetary policy aggressively to combat excessive inflation. Global financial markets are experiencing significant volatility because of the ongoing conflict and the rate of monetary tightening, which is also increasing demand for safe-haven assets like the US dollar. These changes are having significant negative spillover effects on developing market economies and pose significant downside risks to those nations' economic prospects (Monetary Policy September 2022).
-
In the banking industry, private sector banks continue to outperform their counterparts in the public sector in terms of loan growth, both wholesale and retail.
-
Asset quality in the banking sector has increased during the past year, helped by an uptick in economic activity. Even if concerns about restructured credit persist, bad loans decreased by around 185 basis points to 5.7% of all loans.
-
Non-performing assets (NPAs) are on a relatively low level on banks' balance sheets, drop for both wholesale and retail loans, and have enough capital buffers. In a dynamic climate marked by significant uncertainty, the drop in risk-weighted assets shows that banks are still cautious about the risk profile of borrowers.
-
The Morgan Stanley study stated that "strong balance sheets, waning economic concerns, and better capacity utilization lay the scenario for a Capex up-cycle in FY24-FY25, which might fuel a second leg of rerating at Indian banks."
-
S&P Global Ratings projected that bad loans in India’s banking sector will decline to 5% - 5.5% of gross loans by 31 March 2024. Credit costs are predicted to settle around 1.5% for FY23 and then normalize further to 1.3%, bringing them comparable to those of other emerging economies and the 15-year average for India.
-
According to rating agency ICRA, bank bad loan ratios are anticipated to further decrease to 5.2–5.3% by 31 March 2023 due to a lower slippage rate and stronger credit growth.
Concall Overview (Q1FY2023)
-
When it comes to asset quality, the management has seen that this trend of improved asset quality has continued throughout the pandemic. As management has previously mentioned, the expansion of the corporate credit cycle, which is currently at its lowest point, has been a major factor in this.
-
Net NPAs and Gross NPAs both continue to decline. As seen by the provision coverage ratio of almost 90% and the fact that net NPA is actually down to roughly 1.5%, the bank is in a strong position and faces little risk from its current NPA book. In line with the guidance, the slippage ratio has also been decreasing. According to management's guidance, the slippage ratio would be between 1.5% and 2%. As a result, it came out to be 1.71%, and there is yet room for improvement.
-
Collection efficiency has increased and is currently at roughly 98%.
-
The Bank's capital adequacy ratio is still within a relatively safe range of between 15.5 and 16%. Management believes that internal accruals should also be sufficient to finance expansion this year.
-
₹19,666 crores is the total amount of the restructured book. In the first quarter of FY23, there was a slippage of almost ₹1,000 crores. Only 15–16% of the bank's repayments are strained, according to SMA 1 and 2, the majority of which are healthy.
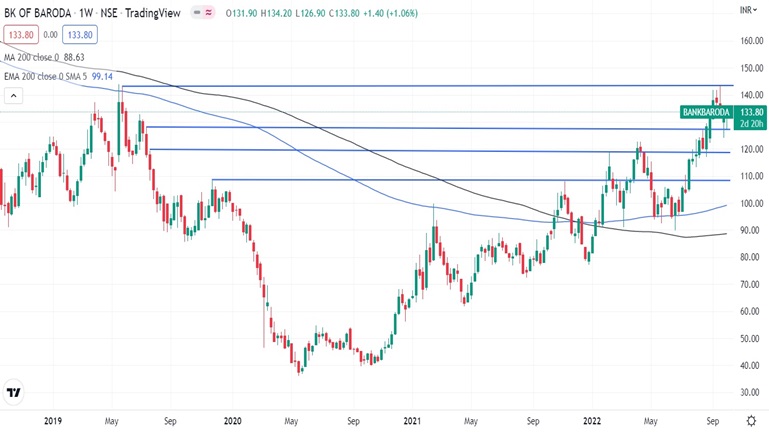
Bank of Baroda - Technical Analysis
-
Stock is trading above EMA 200 and MA 200 indicators, with a support level of ₹120 and a resistance level of ₹143.
-
Share is trading in an upward trend on weekly and monthly charts.
-
One can accumulate this stock at current levels.
Bank of Baroda - Peers Comparison
|
|
FY-2022 |
|||
|
|
GNPA |
NPA |
ROA |
ROE |
|
State Bank of India Limited |
4% |
1.02% |
0.56% |
12.53% |
|
Bank of Baroda Limited |
7% |
1.72% |
0.58% |
8.54% |
|
Bank of Baroda Limited |
12% |
4.80% |
0.28% |
4.26% |
Bank of Baroda - Recommendation Rationale
-
In terms of assets, activity, and outreach, BOB is one of the largest nationalized banks and has a history of operations spanning more than 11 decades.
-
Following the merger of Vijaya Bank and Dena Bank with BOB, with effect from April 1, 2019, BOB's geographical reach across India has significantly increased, strengthening its already strong franchise.
-
Through more than 46,000 contact points distributed over 17 countries and five continents, the Bank provides service to its 150 million+ worldwide customers.
-
Bank of Baroda's cost of deposits has been reduced considerably from 4.69% for FY20 (FY21: 3.93%) to 3.31% for FY22 due to an increase in the percentage of CASA deposits in total deposits (along with a decrease in bulk deposits).
-
With frequent capital injections and initiatives to boost capitalization, operational effectiveness and asset quality, the GOI has assisted public sector banks. Given that BOB is one of the largest public sector banks and has systemic importance, timely and consistent support from GOI to maintain the capitalization, as expected, will continue to be a key rating sensitivity.
-
Following its merger with Dena Bank and Vijaya Bank three years ago, the bank has experienced an improvement in its capitalization levels with an adequate capital buffer over the statutory limitations. The healthy capital buffer has improved the capacity to absorb asset quality concerns and sustain growth in the short term.
-
Except for the final quarter of FY22, when interest rates began to rise, the bank's net interest margin (NIM) increased to 2.72% for FY22 from 2.59% for the prior year due to a greater decline in deposit costs than a decline in yields. Due to much lower treasury revenue (mark-to-market losses during Q4FY22) than the prior year, the bank's non-interest income decreased by 6% during FY22 even if the fee income increased. The bank modified its tax policy in FY21, which resulted in a huge tax outlay (one-off) and a reduced PAT of 1,547.67 crores. This PAT dramatically increased to 7,849.69 crores in FY22, corresponding to a ROTA of 0.62% in FY22 as opposed to 0.13% in FY21.
-
With a Gross NPA of 7% as of March 31, 2022 (June 30, 2022: 6%) as opposed to 9% as of March 31, 2021, BOB's asset quality improved but remains modest.
-
Strong retail and CASA depositor bases sustain the bank's liquidity profile.
Valuation
-
The Bank’s Net Interest Income has grown at a CAGR of 20 % from FY 2018-2022.
-
The Bank’s Net Profit has grown from (₹1,887.11) in FY 2018 to ₹7,849.69 in FY2022.
-
The Bank’s return on average net worth has improved from 2.28% to 9.08% during FY 2019–22.
-
We anticipate the company could generate higher Net Interest income for the following FY 2023, comparable to the prior year, based on the company's present performance in FY 2022.
-
We used data from the last five years (2018-2022) to anticipate revenue for the fiscal years 2023–2027.
Bank of Baroda - Estimated Income Statement (₹ in crores)
|
|
Mar-23 |
Mar-24 |
Mar-25 |
Mar-26 |
Mar-27 |
|
|
2023-E |
2024-E |
2025-E |
2026-E |
2027-E |
|
Interest income |
82,450 |
92,634 |
1,04,076 |
1,16,931 |
1,31,374 |
|
Interest Expended |
41,692 |
44,783 |
48,102 |
51,667 |
55,497 |
|
Net Interest Income |
40,757 |
47,851 |
55,974 |
65,264 |
75,877 |
|
|
|
|
|
|
|
|
Other income |
15,797 |
17,337 |
19,026 |
20,880 |
22,914 |
|
Total income |
56,555 |
65,188 |
75,000 |
86,144 |
98,792 |
|
|
|
|
|
|
|
|
Other expenses |
26,579 |
29,751 |
33,303 |
37,282 |
41,740 |
|
Provision and Contingencies |
21,146 |
23,669 |
26,495 |
29,661 |
33,207 |
|
PAT |
8,830 |
11,768 |
15,202 |
19,200 |
23,844 |
-
We initiate coverage on Bank of Baroda Limited with a “Buy” and a 1-year Target Price of ₹166.
Disclaimer: This report is only for the information of our customers Recommendations, opinions, or suggestions are given with the understanding that readers acting on this information assume all risks involved. The information provided herein is not to be construed as an offer to buy or sell securities of any kind.
- Share :


Post a Comment
|
DISCLAIMER |
This report is only for the information of our customers. Recommendations, opinions, or suggestions are given with the understanding that readers acting on this information assume all risks involved. The information provided herein is not to be construed as an offer to buy or sell securities of any kind. ATS and/or its group companies do not as assume any responsibility or liability resulting from the use of such information.