Amara Raja Batteries Limited Research Report
Amara Raja Batteries Limited
|
Industry |
Market Price |
Recommendation |
Target |
Time Horizon |
|
Auto Ancillaries |
577.15 |
Buy |
736 |
1-Year |
Q3 FY 2022 Review
Amara Raja Batteries Limited reported net revenue of ₹2,365.87 crores for the quarter ended December 31, 2021, compared to ₹1,960.43 crores for the quarter ended December 31, 2020. EBIT and Profit After Tax were ₹200.82 crores and ₹145.30 crores for the quarter ended, 31, 2021, as compared to ₹262.51 crores and ₹193.69 crores, during the corresponding quarter of the previous year.
Amara Raja Batteries Limited - Investment Summary
|
CMP (₹) |
577.15 |
|
52 Week H/L |
520/865 |
|
Market Cap (crores) |
9,858 |
|
Face Value (₹) |
1.00 |
|
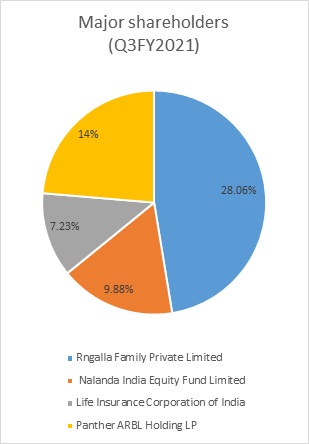
Promoter Holding (%) |
28.06 |
|
Non-Promoter Holding (%) |
71.94 |
|
Total (%) |
100.00 |
|
Book Value |
₹246.48 |
|
EPS TTM |
₹37.86 |
Overview
-
Amara Raja to invest in InoBat Auto, a European technology developer and manufacturer of premium innovative batteries for E-mobility.
-
The initial investment will give Amara Raja a key foothold in the thriving European EV Ecosystem. Multiple battery Giga factories are being set up to support the region’s determined EV push, including the UK, which is seeing a rising need to address the increasing demand for electric vehicles.
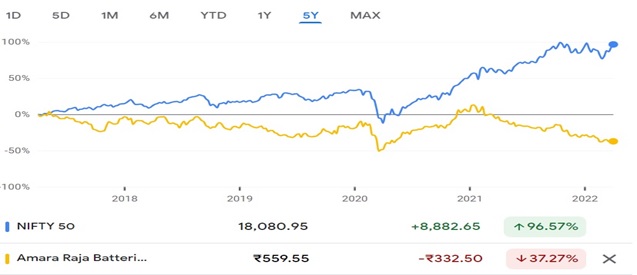
Beta: 0.86 |
Alpha: -16.30 |
Risk Reward Ratio: 1.54 |
Margin of Safety: 24% |
Amara Raja Batteries Limited - Quarterly Summary
|
Quarterly (INR in crore) |
Dec-21 |
Sep-21 |
Jun-21 |
Mar-21 |
Dec-20 |
|
Sales |
2,365.87 |
2,264.15 |
1886.17 |
2102.61 |
1960.43 |
|
Other Income |
18.95 |
26.44 |
16.62 |
32.09 |
35.2 |
|
Total Revenue |
2,384.82 |
2,290.59 |
1,902.79 |
2,134.70 |
1,995.63 |
|
Total Expenditure |
2,183.35 |
2093.61 |
1732.44 |
1873.26 |
1732.62 |
|
EBIT |
201.47 |
196.98 |
170.35 |
261.44 |
263.01 |
|
Interest |
3.77 |
3.56 |
3.15 |
2.75 |
2.61 |
|
EBT |
197.70 |
193.42 |
167.20 |
258.69 |
260.40 |
|
Tax |
52.4 |
49.1 |
43.1 |
69.31 |
66.71 |
|
Net Profit |
145.30 |
144.32 |
124.10 |
189.38 |
193.69 |
Business
-
Amara Raja Batteries Limited, the flagship company of the Amara Raja Group, is the technology leader and is one of the largest manufacturers of lead-acid batteries for both industrial and automotive applications in the Indian storage battery industry.
-
The company has a market share of around 40% in the organized market in lead-acid batteries.
-
In India, Amara Raja is a preferred supplier to major Telecom Service providers, Telecom Equipment manufacturers, UPS sector (OEM & Replacement), Indian Railways, and Power Oil & Gas, among other industry segments.
-
The company has prestigious original equipment manufacturers clients. The company’s Industrial and Automotive batteries are exported to 35 countries across the globe.
-
The company has strengthened its position in the green energy space by launching long warranty variants of the Amaron Solar Tubular & VRLA series. The company now caters to a complete range of 2 volt & 12-volt VRLA and a tubular range of batteries to suit all applications in renewable energy space.
-
The company, on April 30, 2021, received closure orders from the Andhra Pradesh Pollution Control Board (APPCB) for the company’s plants situated at Karakambadi Tirupati and Nunegudlapalli village in Chittoor District. Consequently, the company went in ap against the order of the High Court of Andhra Pradesh at Amaravati, which granted interim orders; the management is working with APPCB to satisfactory resolve the matter.
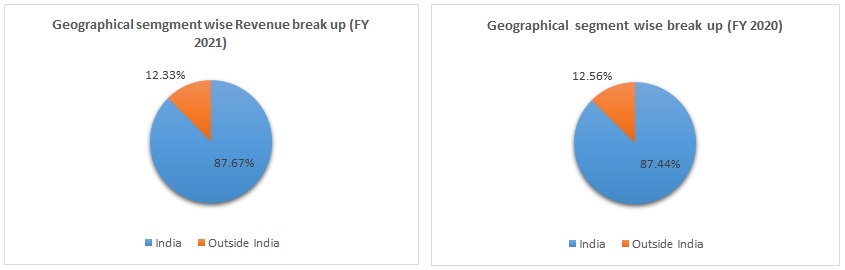
-
Out of the total revenue, 87.67% of revenue have generated from India and 12.33% from other countries in FY 2021, compared to 87.44% and 12.56% in FY 2020.
Revenue Trend
Topline and Bottomline trend (crores)
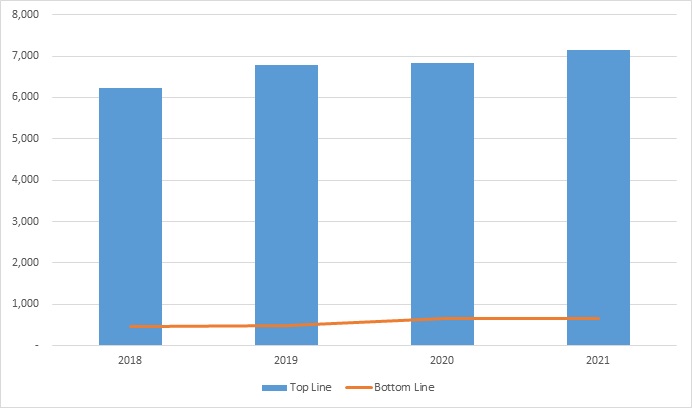
-
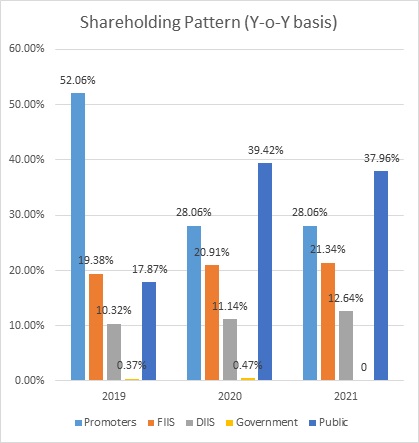
The company’s promoter’s shareholding was reduced from 52.06% to 28.06% due to the termination of shareholder agreements between Galla Family, Johnson Controls (Mauritius) Private Limited, and Johnson Controls Battery Group as of April 01, 2019.
Ratio Analysis
|
|
Mar-18 |
Mar-19 |
Mar-20 |
Mar-21 |
|
Profitability Ratio |
|
|
|
|
|
EBITDA Margin |
35.02% |
32.32% |
35.78% |
34.86% |
|
EBIT Margin |
15.24% |
14.70% |
16.87% |
16.83% |
|
Pre-Tax Margin |
11.46% |
10.75% |
12.29% |
12.22% |
|
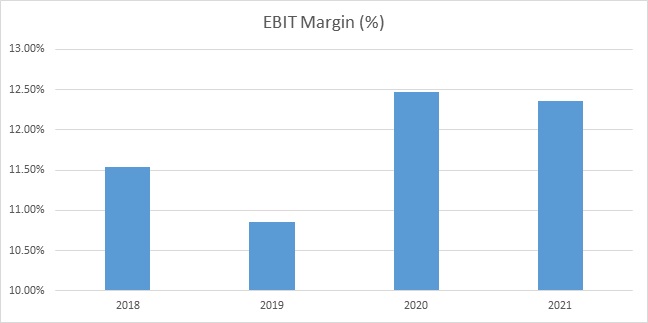
Net Profit Margin |
11.54% |
10.85% |
12.47% |
12.36% |
|
|
7.56% |
7.11% |
9.66% |
9.05% |
|
Return on Investment |
|
|
|
|
|
Return on Asset – ROA |
17.04% |
15.41% |
18.91% |
16.45% |
|
Return on Capital Employed – ROCE |
38.08% |
33.68% |
34.21% |
32.53% |
|
Return on Equity – ROE |
17.04% |
15.41% |
18.91% |
16.45% |
|
|
|
|
|
|
|
Liquidity Ratio |
|
|
|
|
|
Current ratio (x) |
2.17 |
2.44 |
2.02 |
2.12 |
|
Quick Ratio |
17% |
15% |
19% |
16% |
|
|
|
|
|
|
|
Turnover Ratio |
|
|
|
|
|
Receivables Turnover |
40 |
42 |
37 |
36 |
|
Inventory Turnover |
83 |
83 |
90 |
99 |
|
Payables Turnover |
44 |
41 |
41 |
48 |
|
Asset Turnover |
78 |
84 |
87 |
88 |
Amara Raja Batteries Limited - Financial Overview
Amara Raja Batteries Limited - Profit and Loss Statement (₹ in Crores)
|
|
Mar-18 |
Mar-19 |
Mar-20 |
Mar-21 |
|
Revenue |
6,232.98 |
6,793.11 |
6,839.17 |
7,149.78 |
|
Other Income |
66.37 |
46.77 |
55.05 |
87.36 |
|
Total Revenue |
6,299.35 |
6,839.88 |
6,894.22 |
7,237.14 |
|
|
||||
|
Cost Of Goods Sold |
4,116.25 |
4,644.10 |
4,446.85 |
4,744.38 |
|
Gross Profit |
2,183.10 |
2,195.78 |
2,447.37 |
2,492.76 |
|
|
||||
|
Excise Duty |
173.83 |
- |
- |
- |
|
Employee Benefits Expenses |
308.99 |
345.39 |
385.81 |
426.64 |
|
Others Expenses |
750.68 |
852.13 |
907.97 |
863.08 |
|
EBITDA |
949.60 |
998.26 |
1,153.59 |
1,203.04 |
|
|
||||
|
Depreciation And Amortisation |
230.34 |
261.20 |
300.74 |
319.16 |
|
EBIT |
719.26 |
737.06 |
852.85 |
883.88 |
|
|
||||
|
Finance Cost |
5.06 |
6.95 |
12.19 |
10.53 |
|
EBT |
714.20 |
730.11 |
840.66 |
873.35 |
|
|
||||
|
Tax Expenses |
242.88 |
246.88 |
179.86 |
226.52 |
|
PAT |
471.32 |
483.23 |
660.80 |
646.83 |
|
|
||||
|
EPS |
||||
|
Basic |
27.59 |
28.29 |
38.69 |
37.87 |
|
Diluted |
27.59 |
28.29 |
38.69 |
37.87 |
|
|
|
|
|
|
|
Number Of Shares |
||||
|
Basic |
17.08 |
17.08 |
17.08 |
17.08 |
|
Diluted |
17.08 |
17.08 |
17.08 |
17.08 |
Cash Flow Statement (₹ in crores)
|
|
Mar-18 |
Mar-19 |
Mar-20 |
Mar-21 |
|
Net Profit Before Tax |
714.20 |
730.11 |
840.66 |
873.35 |
|
Net Cash from Operating Activities |
321.66 |
541.14 |
1176.56 |
802.21 |
|
Net Cash Used for Investing Activities |
(244.26) |
(462.86) |
(849.36) |
(634.97) |
|
Net Cash From (Used For) Financing Activities |
(138.16) |
(91.62) |
(363.79) |
(121.50) |
|
Net Increase in Cash and Cash Equivalents |
(60.76) |
(13.34) |
(36.59) |
45.74 |
|
Cash And Cash Equivalents at The Beginning of The Year |
100.74 |
48.73 |
50.23 |
32.62 |
|
Cash And Cash Equivalents at The End of Year |
48.73 |
50.23 |
32.62 |
96.93 |
Balance Sheet (₹ in crores)
|
|
Mar-18 |
Mar-19 |
Mar-20 |
Mar-21 |
|
ASSETS: |
|
|
|
|
|
Non-current Assets: |
|
|
|
|
|
Property, Plant and Equipment |
1,698.19 |
1,809.05 |
1,647.61 |
2,116.03 |
|
Right-of Use Asset |
- |
- |
178.48 |
243.65 |
|
Capital Work-In-Progress |
226.38 |
233.88 |
732.58 |
397.56 |
|
Other Intangible Assets |
5.06 |
3.71 |
3.13 |
95.08 |
|
Intangible Assets Under Development |
- |
80.86 |
94.44 |
1.72 |
|
Finance Assets: |
||||
|
Investments |
19.81 |
19.88 |
13.35 |
6.55 |
|
Other Financial Assets |
5.27 |
6.95 |
6.36 |
4.31 |
|
Income Tax Assets |
18.58 |
21.48 |
26.21 |
- |
|
Other Non-Current Assets |
42.96 |
115.78 |
74.99 |
110.75 |
|
Total Non-Current Assets |
2,016.25 |
2,291.59 |
2,777.15 |
2,975.65 |
|
Current Assets: |
||||
|
Inventories |
1,049.71 |
1,061.42 |
1,143.00 |
1,438.93 |
|
Financial Assets: |
||||
|
Investments |
15.33 |
0.30 |
142.25 |
273.42 |
|
Trade Receivables |
782.45 |
768.58 |
636.30 |
786.93 |
|
Cash and Cash Equivalents |
48.73 |
50.23 |
32.62 |
96.93 |
|
Other Bank Balances |
62.55 |
21.60 |
51.91 |
79.08 |
|
Other Financial Assets |
9.15 |
8.60 |
11.53 |
25.52 |
|
Other Current Assets |
184.38 |
293.38 |
205.64 |
120.43 |
|
Total Current Assets |
2,152.30 |
2,204.11 |
2,223.25 |
2,821.24 |
|
Total Assets |
4,168.55 |
4,495.70 |
5,000.40 |
5,796.89 |
|
Equity And Liabilities: |
||||
|
Equity: |
||||
|
Equity Share Capital |
17.08 |
17.08 |
17.08 |
17.08 |
|
Other Equity |
2,920.31 |
3,317.96 |
3,638.23 |
4,192.91 |
|
Total Equity |
2,937.39 |
3,335.04 |
3,655.31 |
4,209.99 |
|
Liabilities: |
||||
|
Financial Liabilities: |
||||
|
Borrowings |
58.43 |
46.80 |
34.34 |
23.39 |
|
Lease Liabilities |
- |
- |
21.67 |
38.59 |
|
Provisions |
45.15 |
69.46 |
83.77 |
95.41 |
|
Deferred Tax Liabilities |
87.81 |
95.91 |
44.13 |
40.74 |
|
Other Non-Current Liabilities: |
46.79 |
45.98 |
59.13 |
59.26 |
|
Total Non-Current Liabilities |
238.18 |
258.15 |
243.04 |
257.39 |
|
Current Liabilities: |
||||
|
Financial Liabilities: |
||||
|
Trade Payables: |
||||
|
Total Outstanding Dues of Micro and Small Enterprise |
10.28 |
59.60 |
73.91 |
44.14 |
|
Other Creditors |
581.98 |
450.85 |
541.04 |
702.36 |
|
Other Financial Liabilities |
168.44 |
170.55 |
204.92 |
216.28 |
|
Lease Liabilities |
- |
- |
15.43 |
19.39 |
|
Provisions |
55.96 |
61.89 |
99.41 |
118.60 |
|
Current Tax Liabilities |
- |
- |
- |
4.18 |
|
Other Current Liabilities |
176.32 |
159.62 |
167.34 |
224.56 |
|
Total Current Liabilities |
992.98 |
902.51 |
1,102.05 |
1,329.51 |
|
Total Equity & Liabilities |
4,168.55 |
4,495.70 |
5,000.40 |
5,796.89 |
Industry Overview
-
The battery market in India is expected to record a CAGR of more than 15%.
-
The Outbreak of the Covid-19 pandemic in Q1 2020 had a significant impact on the growth of the battery market in the country.
-
The lockdown measures imposed by the government to stop the outspread of covid-19 negatively impacted major shipping events for the manufacturing units of lithium-ion and lead-acid batteries in the country.
-
Factors such as the emergence of new and exciting markets, i.e., electric vehicles and battery energy storage systems for different applications, are expected to be the major drivers for the battery market in India.
-
Plans for the local manufacturing of lithium-ion batteries in India are expected to bring down the EV cost and reduce the dependency and import duties that are likely to provide an opportunity for the lithium-battery market.
-
India is one of the most significant automobiles globally, and, in FY 2021, the total automobile production reached 2,26,52,108 units. The country produced 6,24,939 commercial vehicles in FY 2021.
-
The Two-wheeler segment dominates the automotive market owing to a growing middle class and a young population. The Indian Automotive replacement battery market is leading the lead-acid battery market.
-
The government’s efforts to boost automotive battery manufacturing in India will drive the segment’s growth. On November 11, 2020, the Indian government announced incentives worth INR 3 trillion (approximately USD 40 billion) to encourage companies in ten sectors to boost local manufacturing and increase exports. The incentive scheme worth INR 180 billion (about USD 2.4 billion) will be directed toward advanced cell chemistry, bringing at least 50 GW of lithium-ion batteries manufactured in India.
-
With an increasing population and accessible financing facilities, the automobile sector is expected to grow significantly during the study period. Electric vehicle (EV) sales are expected to support the segment.
-
The demand for lithium batteries in non-automotive applications is forecast to increase from 0.3 GWh to 12 GWh, driven by telecom towers, data centers, grid-scale renewable energy (RE) integration, and rooftop solar.
Peer Comparison
|
|
|
9 -Months FY-2022 |
Ratio- (FY-2021) |
||
|
|
Market Cap. (cr.) |
Revenue (cr.) |
PAT (cr.) |
ROCE |
ROE |
|
Amara Raja Batteries Limited |
9,664 |
6,516.19 |
413.72 |
33% |
16% |
|
Exide Industries Limited |
13,510 |
8,973.05 |
563.88 |
15% |
11% |
Amara Raja Batteries Limited - Technical Analysis
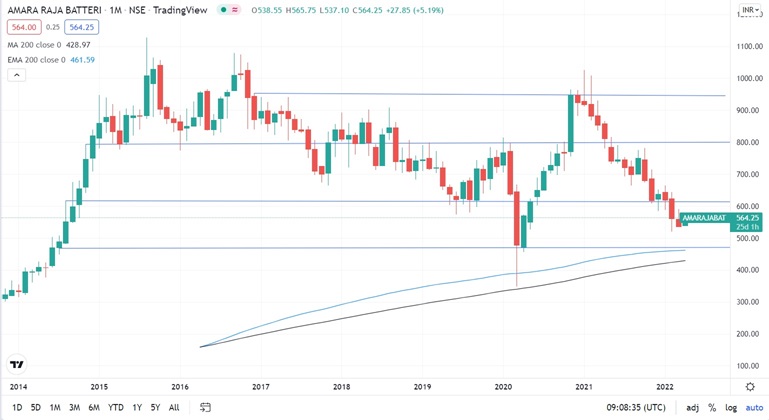
-
Stock is trading above EMA 200 and MA 200 indicators, with a strong support level of ₹616 and a resistance level at ₹798.
-
One can accumulate this share at the current price.
Recommendation Rationale:
-
For the first nine months, Amara Raja Batteries Limited’s revenue increased by 29.10% to ₹6,516.19 crores, compared to the previous year at ₹5,047.17 crores. Profit After Tax reduced by 10.56% to ₹413.72 crores, compared to the last year at ₹457.45 crores.
-
Amara Raja is expected to be the beneficiary of improving business outlook for the automotive battery demand and replacement.
-
The contribution of revenue in exports is also increasing over the years, which will benefit the company in acquiring more clients outside India.
-
The company’s distribution network comprises 23 branches, 32 warehouses, 400+ Amaron Franchisees, 40000+ Amaron Dealers, and 2000+ Extensive Service hubs.
-
The company is virtually debt-free.
-
The company has a good client base in the automobile and telecommunication sectors.
-
Amara will establish a new energy SBU encompassing lithium cell and battery packs, EV charges, energy storage systems, advanced home energy solutions, and other related products and services.
-
Amara Raja has participated in the production-linked incentive scheme for the National Programme on Advanced Chemistry Cell (ACC) Battery Storage issued by the Ministry of Heavy Industries.
-
With recovery demand in the automobile sector, increasing use of batteries in different sectors like telecommunication, railways, and data centers, will increase demand for the company’s products.
Valuation
-
The company has grown at a 4.56% Compounded annual growth rate from FY 2018 to FY 2021.
-
The company’s net profit was impacted in FY 2021 due to the covid-19 pandemic and increased raw materials prices.
-
The company’s ROE is more than 15%, and its ROCE is more than 30%.
-
Based on the current performance of the company in the first nine months, we expect the company could post higher revenue for the current financial (2022), corresponding to the previous year.
-
We have taken data for the last five years (2017-2021) and forecasted revenue for FY 2022-2026. Revenue growth is assumed to be 4.60%.
Estimated Income Statement (₹ in crores):
|
|
Mar-22 |
Mar-23 |
Mar-24 |
Mar-25 |
Mar-26 |
|
|
2022-E |
2023-E |
2024-E |
2025-E |
2026-E |
|
Revenue |
7,568.00 |
7,914.04 |
8,275.97 |
8,654.51 |
9,050.42 |
|
COGS |
4,962.77 |
5,191.21 |
5,430.17 |
5,680.12 |
5,941.59 |
|
Gross Profit |
2,605.23 |
2,722.83 |
2,845.80 |
2,974.38 |
3,108.84 |
|
Employee Expenses |
446.28 |
466.82 |
488.31 |
510.79 |
534.30 |
|
Other Expenses |
902.81 |
944.37 |
987.84 |
1,033.31 |
1,080.87 |
|
EBITDA |
1,256.14 |
1,311.65 |
1,369.66 |
1,430.29 |
1,493.67 |
|
Depreciation |
409.31 |
417.67 |
428.18 |
440.63 |
454.88 |
|
EBIT |
846.83 |
893.97 |
941.48 |
989.65 |
1,038.78 |
|
Financial Cost |
10.09 |
10.65 |
11.22 |
11.79 |
12.38 |
|
EBT |
836.75 |
883.32 |
930.26 |
977.86 |
1,026.41 |
|
Tax expenses |
217.03 |
229.11 |
241.28 |
253.63 |
266.22 |
|
PAT |
619.72 |
654.22 |
688.98 |
724.24 |
760.19 |
-
We initiate coverage on Amara Raja Batteries Limited with a “BUY” and a 1 Year Target Price of 736.
Disclaimer: This report is only for the information of our customers Recommendations, opinions, or suggestions are given with the understanding that readers acting on this information assume all risks involved. The information provided herein is not to be construed as an offer to buy or sell securities of any kind.
- Share :


Post a Comment
|
DISCLAIMER |
This report is only for the information of our customers. Recommendations, opinions, or suggestions are given with the understanding that readers acting on this information assume all risks involved. The information provided herein is not to be construed as an offer to buy or sell securities of any kind. ATS and/or its group companies do not as assume any responsibility or liability resulting from the use of such information.