8K MILES SOFTWARE SERVICE
8K Miles Software Services Ltd is a leading global Cloud & Security solutions company headquartered in the San Francisco Bay area and a publicly traded on Indian Stock Exchanges. It provides internet services in the cloud space; the services include cloud consulting and migration, big data services, and remote infrastructure and management.
|
KEY PARAMETERS |
|
|
BSE |
512161 |
|
NSE |
8KMILES |
|
REUTERS |
8KMS.NS |
|
INCEPTION |
May 1993 |
|
INDUSTRY |
INTERNET - SOFTWARE |
|
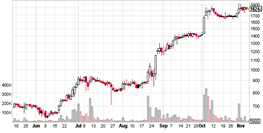
CMP (as on 6/11/2015) |
1770 |
|
Stock Beta |
|
|
52 Week H/L |
480 / 1919.90 |
|
Market Cap (Cr) |
1917.82 |
|
Equity Capital (cr) |
10.89 |
|
Face Value (Rs) |
10 |
|
Average Volume |
27228 |
|
Shareholding Pattern (%) |
|
|
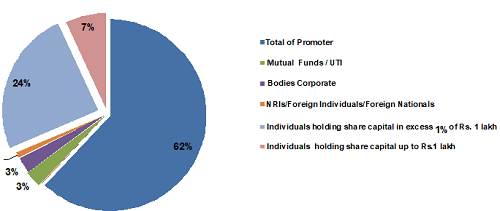
Promoters |
61.96 |
|
Non Institutions |
38.04 |
|
Grand Total |
100.00 |
-
Healthy acquisitions in Healthcare and Pharma Sector to gain more market share of Cloud in Pharma Sector.
-
Govt. policies like Obama care and Digital India to boost additional revenue.
-
Exceptional Revenue growth and PAT growth in triple digit will be driving force.
-
Excellent opportunity in Cloud and IoT industry which is expected to grow more than 20% for next few years.
8K Miles Software Services Ltd - Recommendation
8K Miles has a strong market share for its core products that make up over 100% of revenue. With its substantial liquidity and financial strength along with strong recurring revenue streams, high customer retention rates due to high software switching costs, the company is well positioned to address challenges related to technology evolution through acquisitions and internal investments.
We recommend BUY on the stock at CMP of Rs.1770 to target of Rs. 2335 (Forward EPS of 64xFY16) for the FY16.
8K Miles Software Services Ltd - Financial Summary
|
Yearly Income Statement |
2014 |
2015 |
2016 E |
2017 E |
|
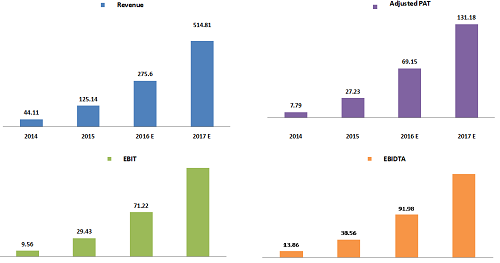
Revenue |
44.11 |
125.14 |
275.60 |
514.81 |
|
EBIDTA |
13.86 |
38.56 |
91.98 |
178.96 |
|
EBIT |
9.56 |
29.43 |
71.22 |
142.41 |
|
Adjusted PAT |
7.79 |
27.23 |
69.15 |
131.18 |
|
EPS |
7.25 |
25.34 |
64.36 |
122.10 |
|
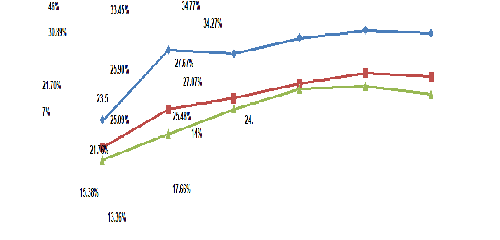
EBIDTA Margin |
31.46% |
30.89% |
33.45% |
34.77% |
|
EBIT Margin |
21.70% |
23.57% |
25.90% |
27.67% |
|
PAT Margin |
17.66% |
21.76% |
25.09% |
25.48% |
8K Miles Software Services Ltd - BUSINESS DESCRIPTION
8K Miles Software Services Limited, formerly P.M. Strips Limited, is an India-based online outsourcing provider. The Company is engaged in online outsourcing of software and other knowledge services over the Internet. The Company is an outsourcing that provides on-demand access to programmers, project managers and cloud infrastructure to help small and medium businesses drastically bring down their outsourcing costs. It operates under the Virtual Computing Environment, which provides companies with on-demand access to computing infrastructure to bring products/projects to life, while protecting intellectual property and enabling project continuity. It provides its services to small and medium businesses; information technology services companies, and entrepreneurs.
It started with the vision of creating a distributed on demand platform, where developers and managers alike from across the globe could collaborate and execute their ideas. From this simple, yet powerful idea 8KMiles has grown into a global organization with offices and clients throughout the world. The focus of the company is clear- to help organizations Embrace the Cloud – Security 8K Miles has been helping to educate the market by bringing innovative solutions for public cloud by joining forces with leading providers in the cloud space, such as: AWS, MS Azure and IBM.
Cloud Partners
Some Clients Include
It recently announced the appointment of Strategic Advisory Board members that also broadens Company's access to previously untapped business opportunities. Advisory Board aim is to accelerate the 8K Miles global insights on cloud, SaaS, mobility, infrastructure scalability, big data, analytics, security, compliance, and identity management areas, as the company continues growing both: organically and through M&A's.
Shareholding pattern as on 30th Sept, 2015
|
|
No of Shares |
No of Shares |
No of Shares |
No of Shares |
|
Description as on |
30/09/2015 |
31/03/2015 |
30/09/2014 |
31/12/2013 |
|
Foreign (Promoter & Group) |
0 |
0 |
0 |
6595140 |
|
Indian (Promoter & Group) |
6657128 |
6657128 |
6656935 |
61795 |
|
Total of Promoter |
6657128 |
6657128 |
6656935 |
6656935 |
|
Non Promoter |
|
|
|
|
|
Financial Institutions / Banks |
10937 |
537 |
3000 |
0 |
|
Mutual Funds / UTI |
303529 |
303529 |
504029 |
0 |
|
Non Promoter (Non-Institution) |
3772508 |
3382908 |
2880138 |
3387167 |
|
Bodies Corporate |
287539 |
313470 |
332567 |
270695 |
|
Clearing Members |
9537 |
31265 |
23935 |
3774 |
|
NRIs/Foreign Individuals/Foreign Nationals |
103443 |
139653 |
116907 |
464927 |
|
Individuals holding share capital in excess of Rs. 1 lakh |
2639783 |
2055376 |
3387167 |
1901278 |
|
Individuals holding share capital up to Rs. 1 lakh |
732206 |
843144 |
10044102 |
721993 |
|
Total Non Promoter |
4086974 |
3686974 |
3387167 |
3387167 |
|
Grand Total |
10744102 |
10344102 |
10044102 |
10044102 |
MANAGEMENT & GOVERNANCE
|
Name |
Designation |
|
Suresh Venkatachari |
Managing Director, CEO |
|
R S Ramani |
Whole-time Director |
|
Padmini Ravichandran |
Director |
|
J Gurumurthi |
Director |
|
Jayashree Jagannathan |
Company Secretary |
|
Lakshmanan Kannappan |
Director |
Suresh Venkatachari - CEO has more than 26+ years of experience in the IT solutions & consulting industry.
Lena kannappan – Chief Operating Officer and Head of Cloud IAM business for 8KMiles, he is a visionary leader who leads and directs the business operations for 8KMIles.
Harish Ganesan - is the Chief Technology Officer (CTO) and Co-Founder of 8KMiles. Harish Ganesan has more than 16+ years of experience in architecting and developing cloud computing, e-commerce and mobile application systems.
R.S.Ramani – CFO - With 27+ years of experience in finance roles, the key areas of focus for Ramani is Finance, Accounting, Auditing and operations in IT, Education and Trading Industries.
Company has GHG Associates as its auditors.
|
As of 30th Sept |
|
|
Face Value |
10 |
|
Equity |
10.89 |
|
Market Capitalization |
1988.72 |
|
Sector P/E |
18.26 |
|
Enterprise Value |
1974.01 |
|
EPS(Adjusted) |
18.35 |
|
P/E |
72.01 |
|
Book Value |
106.37 |
|
P/BV |
17.16 |
|
Dividend Yield-% |
0 |
|
Top Fund Holdings |
Market Value Sep2015 |
Market Value Aug2015 |
Change in Value |
% Change |
|
DSP BlackRock Mutual Fund |
42.5229 |
36.2702 |
6.25 |
17.23 |
INDUSTRY OUTLOOK
The IT industry is being driven by digital business, and an environment driven by a connected world. Gartner predicts spending on Internet of Things (IoT) hardware will exceed $2.5 million every minute in 2016. Mike Harris, group vice president at Gartner, explains interconnections, relationships, and algorithms are defining the future of business.
"India will continue to be the fastest growing IT market for the second year in succession and will continue growing to total $87.67 billion by the end of 2019," said Aman Munglani, research director at Gartner. "India is currently the third largest IT market in Asia/Pacific, and by 2019 India will become the second-largest IT market within the Asia/Pacific region, following China."
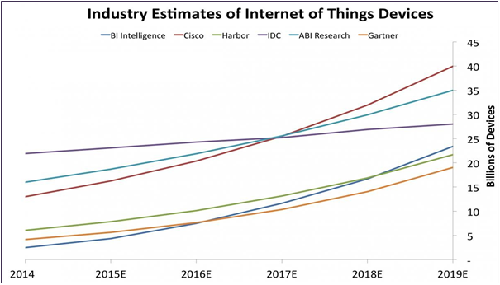
During the past 15 years, the Internet revolution has redefined business-to-consumer (B2C) industries such as media, retail and financial services. In the next 10 years, the Internet of Things revolution will dramatically alter manufacturing, energy, agriculture, transportation and other industrial sectors of the economy which, together, account for nearly two- thirds of the global gross domestic product (GDP). It will also fundamentally transform how people will work through new interactions between humans and machines.
Dubbed the Industrial Internet (of Things), this latest wave of technological change will bring unprecedented opportunities, along with new risks, to business and society. It will combine the global reach of the Internet with a new ability to directly control the physical world, including the machines, factories and infrastructure that define the modern landscape. Industrial Internet is indeed transformative. It will change the basis of competition, redraw industry boundaries and create a new wave of disruptive companies, just as the current Internet has given rise to Amazon, Google and Netflix.
Opportunities and benefits
Research reveals that disruption will come from new value creation made possible by massive volumes of data from connected products, and the increased ability to make automated decisions and take actions in real time. The key business opportunities will be found in four major areas:
-
Vastly improved operational efficiency (e.g., improved uptime, asset utilization) through predictive maintenance and remote management
-
The emergence of an outcome economy, fuelled by software-driven services; innovations in hardware; and the increased visibility into products, processes, customers and partners.
-
New connected ecosystems, coalescing around software platforms that blur traditional industry boundaries.
-
Collaboration between humans and machines, which will result in unprecedented levels of productivity and more engaging work experiences
During the past three years, the number of sensors shipped has increased more than five times from 4.2 billion in 2012 to 23.6 billion in 2014. Much attention is drawn to the efforts by large companies such as Cisco, GE, and Huawei, and government initiatives like Industrie 4.0 in Germany. The Internet of Things World Forum hosted by Cisco featured more than 250 real-world deployment examples showing how companies and municipalities from around the globe are already applying the Industrial Internet to drive efficiencies, create new revenue streams and improve quality of life for citizens and consumers.
INVESTMENT RATIONALE
Healthy acquisitions in Healthcare and Pharma Sector to gain more market share of Cloud in Pharma Sector
8K Miles over the past 12 months has acquired three firms in the health and pharma space. Earlier this year, it had acquired the US-based Cintel Systems, Canada-based Mindprint and another US-based firm SERJ Solutions to strengthen its portfolio in the fast-growing life sciences sector. It also acquired US-based NexAge Technologies, that specializes in the life sciences sector last quarter.
-
Cintel Systems is a user interface (UI) and user experience (UX) design and development services company. The deal size is $3.75 million and is a combination of cash and stock. The acquisition expands the mobile competency of the company's cloud offering and helps it gain access to Cintel's enterprise clients and add over 70 Mobile, UI & UX experts in the US
-
Mindprint is a clinical research software startup focused on analytics and operational software for Clinical Research Organizations (CROs) and Pharmaceutical Sponsors. The acquisition involved $150,000 in cash and $250,000 in stock.
Company said - Mindprint domain knowledge of clinical research and pharma outsourcing operations will provide 8K Miles additional competitive advantage to capitalize on the growth potential in the related markets in India and abroad.
-
SERJ Solutions is a provider of innovative Epic EHR consulting, custom application development, and support solutions for the healthcare market.
―By taking advantage of our expertise in cloud technology and information security, and combining that with deep healthcare domain expertise, this acquisition will allow us to create a compelling suite of cost-effective hosted SaaS solutions that healthcare providers can deploy," said Suresh Venkatachari, chairman and CEO of the company.
-
NexAge Technologies USA Inc. is one of the principal regulatory compliance and technology solutions companies in the U.S. with more than 15 years of experience in Computer Systems Validation, Quality Review, Vendor Audits, Data Analysis and Migration, Analytics, Change Management, as well as Governance for the Life Science and Pharmaceutical industry. The total consideration in cash and stock, for the acquisition, is $3,000,000 dollars ($1,500,000 in cash and $1,500,000 worth of US subsidiary stock).
This acquisition will boost the company's world-class CloudEzRx™ solution that has been designed with an ultimate goal to address qualification and validation compliance for applications running on the cloud securely with the larger purpose of empowering Pharmaceutical and Life Sciences enterprises to utilize cloud services across value and supply chains.
Further company said growth could be through both organic or inorganic routes meaning in future too 8K will seek healthcare, lifescience and pharma sectors as the company sees strong opportunity in the cloud market, which is getting matured.
Government policies to boost demand for Cloud and IoT
The recent Supreme Court order legalizing Obamacare across the US is a big boost to cloud players like 8K Miles.
ObamaCare is a US healthcare reform law that expands and improves access to care and curbs spending through regulations and taxes.
The health law, which will bring millions of uninsured Americans health benefits will be a critical boon to pharmaceutical industry balance sheets, increasing revenue by one-third by the end of the decade, according to a report from research and consulting firm GlobalData of London. That means the U.S. pharmaceutical industry’s market value will mushroom by 33 percent to $476 billion in 2020 from $359 billion last year.
The Life Sciences Industry in the US is currently facing tough IT challenges driven by a need to create more innovative solutions within shrinking IT budgets which makes it even more important to design agile cloud centric solutions and business models that are rapidly scalable. 8K Miles CloudEzRx™ framework enables customers run critical workloads securely on the cloud and is designed to meet security, analytical and operational needs while addressing the unique regulatory compliance requirements faced by Pharmaceutical and Life Sciences companies. The domain expertise of 8K and proprietary IT solutions in data migration and analytics will enhance and further improve the overall portfolio of its solutions targeted to the Life Sciences industry.
Through this acquisition, 8K Miles gains access to the network of Enterprise customers and strategic partners acquired by NexAge during the last decade.
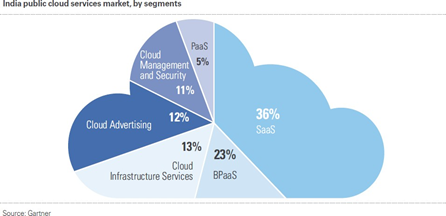
India is investing a great deal to empower citizens and enterprises with cutting-edge technology and infrastructure, and as a result, there is a large demand for Cloud and IoT services.
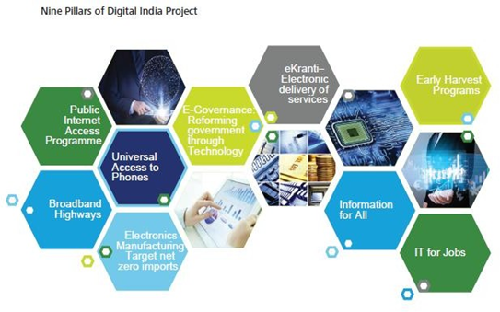
As a part of Digital India programme, Prime Minister Narendra Modi has announced the launch of The Centre of Excellence (CoE) for IoT to enable rapid adoption of IoT technology and foster a new growth strategy as well empower India to have a leap frog advantage in the domain.
In India, Internet of Things (IoT) can be leveraged to address issues like transport system, parking, electricity, waste management, water management and women’s safety to create smart cities, smart health services, smart manufacturing and smart agriculture. Additionally, the smart city and digital India campaign can also leverage IoT to bring about innovative applications and domain capability across verticals.
Department of Electronics and Information Technology has come out with a draft IOT Policy document which focuses on following objectives:
-
To create an IoT industry in India of USD 15 billion by 2020. It has been assumed that India would have a share of 5-6% of global IoT industry.
-
To undertake capacity development (Human & Technology) for IoT specific skill-sets for domestic and international markets.
-
To undertake Research & development for all the assisting technologies.
-
To develop IoT products specific to Indian needs in all possible domains.
Being one of the largest player in both cloud and IoT in India, company will get enough incentive promote itself and boost its revenue.
Cloud and IoT industry itself to grow above 20%
Businesses throughout India as well as India’s own infrastructure and services are undergoing a massive transformation. Reliable networks, innovative Cloud computing and scalable IoT platforms are critical to enabling this revolution.
-
Insurance: Private clouds are preferred because they’re more secure than public clouds. However, it’s expected that by 2016, industry association community clouds will increase in popularity.
-
Banking: uses the cloud for administrative functions like email, file sharing and sharing of notes.
-
Government: While opportunities to use cloud computing in a variety of ways do exist, it’s also misunderstood. Today, the biggest opportunities are in public cloud computing, but many in this industry fear security problems.
-
Retail: In this industry, cloud implementations have been mostly IaaS or PaaS solutions. Security, availability and vendor maturity are all aspects that retailers consider when deciding which functions they want deployed from the cloud.
-
Media: Audiences today can access content of any form in a variety of ways. This is why service providers and application developers are exploring a cloud-based vision way to enable multiscreen entertainment.
-
Manufacturing: This industry uses the cloud for logistics; sales support functions, HR, product development and life cycle management, as well as some manufacturing operations.
With the advent of the Internet of Things (IoT), the number of connected sensors soon will reach trillions, working with billions of intelligent systems involving in-numerous applications will drive new consumer and business behavior. The demand for increasingly intelligent industry solutions based on IoT will drive trillions of dollars in opportunity for IT industry and even more for the companies that take advantage of the IoT.
India is the topmost offshoring destination for IT companies across the world. Having proven its capabilities in delivering both on-shore and off-shore services to global clients, emerging technologies now offer an entire new gamut of opportunities for top IT firms in India. Social, mobility, analytics and cloud (SMAC) are collectively expected to offer a US$ 1 trillion opportunity. Cloud represents the largest opportunity under SMAC, increasing at a CAGR of approximately 30 per cent to around US$ 650-700 billion by 2020. The social media is the second most lucrative segment for IT firms, offering a US$ 250 billion market opportunity by 2020. The Indian ecommerce segment is US$ 12 billion in size and is witnessing strong growth and thereby offers another attractive avenue for IT companies to develop products and services to cater to the high growth consumer segment.
Some Statistics
-
Globally, cloud apps will account for 90% of total mobile data traffic by 2019, compared to 81% at the end of last year. Mobile cloud traffic will grow 11-fold from 2014 to 2019, attaining a compound annual growth rate (CAGR) of 60%. Source: Cisco Visual Networking Index
-
18% of industrial machinery companies (i.e., manufacturers) are already using IoT devices, according to a SAS study.
-
Spending on Internet of Things (IoT) hardware will exceed $2.5 million every minute in 2016 - Gartner
Exceptional Revenue growth and PAT growth in triple digit.
|
Growth |
Yearly |
Quarterly |
|
Revenue CAGR |
95.14% |
25.62% |
|
EBITDA CAGR |
126.24% |
23.52% |
|
EBIT CAGR |
125.11% |
28.37% |
|
PAT CAGR |
129.59% |
31.77% |
8K has an alluring revenue growth of 95% CAGR since 2012 and 25.62% QoQ growth (Geomertric mean) since March 2013. EBIDTA grew 126%. EBIT also had exceptional growth of 125% and profits at 130%.
The acquisition will also offer the benefits of diversification by increasing the proportion of debt in 8K and its subsidary's book. At the same time, the planned transaction continues a shift in 8K Miles's business profile towards longer-dated and more capital-intensive assets, via both organic growth and opportunistic acquisitions.
VALUATION
We expect that 8K will continue to maintain and defend its very strong market positions across a range of business, SaaS, enterprise products and services as well as continue to profitably grow its cloud service offerings..
Company has a strong and leading market share for its core products that make up over 100% of revenue. With its substantial liquidity and financial strength along with strong recurring revenue streams, high customer retention rates due to high software switching costs, the company is well positioned to address challenges related to technology evolution through acquisitions and internal investments.
|
Valuation Ratio |
2011 |
2012 |
2013 |
2014 |
2015 |
|
Price Earning (P/E) |
12.64 |
8.73 |
13.16 |
17.18 |
38.68 |
|
Price to Book Value ( P/BV) |
1.28 |
1.2 |
1.89 |
1.68 |
7.36 |
|
Price/Cash EPS (P/CEPS) |
9.51 |
7.11 |
10.92 |
10.05 |
26.13 |
|
EV/EBIDTA |
8.33 |
6.04 |
9.6 |
7.47 |
18.66 |
|
Market Cap/Sales |
1.62 |
1.45 |
1.99 |
2.37 |
5.88 |
We expects 8K's financial metrics to remain robust over the next 1-2 years.
8K Miles is currently trading at 1770 per share with a market capitalization of 1917.82 Crores. As of March FY15 it had almost nil debt with long term Debt to Equity of 0.03. It has absorbed $800,000 (~Rs 5.2 Cr) debt of NexAge Technologies when it acquired. It has total cash and bank balance of 14 Cr. It is reinvesting all the cash flow for which we expect growth at 87% for the next year. Current PE is marginally higher at 72. Though the stock remains expensive, PEG (price you pay for the growth you get) stands at 0.8276 which is justified by it outstanding growth rate.
We value HCL using DCF at price target of 2335 for FY16 with expected growth rate at 87.16% per annum.
|
Key Ratios |
2012 |
2013 |
2014 |
2015 |
|
Debt-Equity Ratio |
0.09 |
0.1 |
0.07 |
0.02 |
|
Long Term Debt-Equity Ratio |
0.03 |
0.03 |
0.02 |
0.01 |
|
Current Ratio |
1.74 |
1.94 |
2.67 |
3 |
Turnover Ratios
|
Fixed Assets |
3.38 |
6.75 |
1.57 |
1.75 |
|
Debtors |
1.76 |
1.96 |
3.23 |
6.01 |
|
Total Asset Turnover Ratio |
0.63 |
0.71 |
0.66 |
1.08 |
|
Interest Cover Ratio |
85.2 |
27.65 |
25.76 |
65.42 |
|
ROCE (%) |
12.51 |
12.38 |
16.73 |
31.65 |
|
RONW (%) |
14.62 |
14.52 |
16.32 |
26.55 |
Credit Rating (CRISIL)
Long Term Debts - The instrument rated BBB are judged to offer sufficient safety of timely payment of interest and principal for the present; however, changing circumstances are more likely to lead to a weakened capacity to pay interest and repay principal than for instruments in higher rated categories.
|
Du Pont Analysis |
2012 |
2013 |
2014 |
2015 |
|
NP / PBT (X) |
0.83 |
0.88 |
0.66 |
0.65 |
|
PBT / EBIT (X) |
0.99 |
0.96 |
0.96 |
0.98 |
|
EBIT / Sales (X) |
0.2 |
0.18 |
0.22 |
0.24 |
|
Sales / Assets (X) |
0.63 |
0.71 |
0.66 |
1.08 |
|
Assets / Equity (X) |
1.39 |
1.36 |
1.47 |
1.33 |
CONCUSSION AND RECOMMENDATION
|
Nifty |
7950 |
|
Sensex |
26300 |
|
CNX IT |
11450 |
With Superior project management skills, efficiency and higher service level due to streamlined process and its planned expansion 8K Miles Software Solutions will be able to grow over the next few years. We recommend BUY on the stock at CMP of Rs. 1770 to target of Rs. 2335 (Forward EPS of 64x FY16) for the FY16.
RISKS AND CONCERNS
-
8K has absorbed $800,000 (~Rs 5.2 Cr) debt of NexAge Technologies when it acquired which may change the credit rating of the company and the cost of debt is bit of a concern.
-
The slower than expected U.S growth trajectory and sluggish Euro zone growth will drag on external demand.
-
Financial market volatility remains very high from a historical perspective, anticipation of the interest rate hike in the United States—the timing and speed of which is uncertain—could induce sharp movements in term premiums and risk spreads in advanced and emerging market economies.
-
The slowdown in global growth will prove a major headwind for Indian exporters.
FINANCIALS
8K Miles Software Services Ltd. key Products/Revenue Segments include Software Development Charges which contributed Rs 12.39 Cr to Sales Value (100.00% of Total Sales), for the year ending 31-Mar-2015.
For the quarter ended 30-Sep-2015, the company has reported a Standalone sales of Rs. 4.12 Cr., up 3.87% from last quarter Sales of Rs. 3.97 Cr. and up 28.92% from last year same quarter Sales of Rs. 3.19 Cr. Company has reported net profit after tax of Rs. 0.29 Cr. in latest quarter.
|
EquityHistory |
||||||
|
Date |
EquityCapital |
No. ofEquity Shares |
Increase in EquityAmount(Rs Cr) |
No. of Equity SharesIncreased |
Ratio |
Reason |
|
08/10/2015 |
10.89 |
10894102 |
0.15 |
150000 |
0:00 |
Conversion of Warrants |
|
20/04/2015 |
10.74 |
10744102 |
0.4 |
400000 |
0:00 |
Conversion of Warrants |
|
31/03/2015 |
10.34 |
10344102 |
0.1 |
100000 |
0:00 |
Conversion of Warrants |
|
28/01/2015 |
10.24 |
10244102 |
0.2 |
200000 |
0:00 |
Conversion of Warrants |
|
22/06/2012 |
10.04 |
10044102 |
4.02 |
4017641 |
2:03 |
Bonus Issue |
|
12/05/2012 |
6.02 |
6026461 |
0.47 |
472300 |
0:00 |
Preferential Issue Of Shares |
|
31/12/2010 |
5.55 |
5554161 |
3.99 |
3994161 |
0:00 |
Preferential Issue Of Shares |
|
15/01/1997 |
1.56 |
1560000 |
0.6 |
600000 |
0:00 |
Scheme of Arrangement/Amalgamation |
|
31/12/1996 |
0.96 |
0 |
0 |
0 |
0:00 |
As Per Company Data |
|
Balance Sheet |
201103 |
201203 |
201303 |
201403 |
201503 |
|
SOURCES OF FUNDS : |
|
|
|
|
|
|
Share Capital |
5.55 |
5.55 |
10.04 |
10.04 |
10.34 |
|
Reserves Total |
15.14 |
19.96 |
17.55 |
51.96 |
89.44 |
|
Equity Share Warrants |
0 |
0 |
0 |
0 |
0 |
|
Equity Application Money |
0 |
0 |
0 |
0 |
11.5 |
|
Total Shareholders’ Funds |
20.69 |
25.51 |
27.59 |
62 |
111.28 |
|
Minority Interest |
0 |
0 |
0 |
21.13 |
25.24 |
|
Secured Loans |
0.08 |
1.74 |
1.06 |
2.62 |
0.07 |
|
Unsecured Loans |
0.99 |
1.19 |
1.05 |
1.16 |
0 |
|
Total Debt |
1.07 |
2.93 |
2.11 |
3.78 |
0.07 |
|
Policy Holders Fund |
0 |
0 |
0 |
0 |
0 |
|
Other Liabilities |
8.83 |
7.4 |
8.77 |
8.24 |
0 |
|
Total Liabilities |
30.59 |
35.84 |
38.47 |
95.15 |
136.59 |
|
|
|||||
|
APPLICATION OF FUNDS : |
|
|
|
|
|
|
Gross Block |
6.06 |
6.41 |
1.36 |
54.71 |
88.31 |
|
Less: Accumulated Depreciation |
0.01 |
0.44 |
0.64 |
2.45 |
9.19 |
|
Less: Impairment of Assets |
0 |
0 |
0 |
0 |
0 |
|
Net Block |
6.05 |
5.97 |
0.72 |
52.26 |
79.12 |
|
Lease Adjustment |
0 |
0 |
0 |
0 |
0 |
|
Capital Work in Progress |
12.59 |
16.43 |
17.48 |
19.58 |
19.9 |
|
Investments |
0 |
0 |
0 |
0 |
0 |
|
Current Assets, Loans & Advances |
|
|
|
|
|
|
Sundry Debtors |
10.96 |
12.95 |
13.83 |
13.42 |
28.14 |
|
Cash and Bank |
0.44 |
2.97 |
1.45 |
4.83 |
14.78 |
|
Loans and Advances |
0.06 |
0.5 |
4.23 |
2.86 |
2.95 |
|
Total Current Assets |
11.46 |
16.42 |
19.5 |
21.11 |
45.87 |
|
Less : Current Liabilities and Provisions |
|
||||
|
Current Liabilities |
4.42 |
7.72 |
3.31 |
1.05 |
8.68 |
|
Provisions |
0.28 |
0.83 |
2.96 |
2.91 |
6 |
|
Total Current Liabilities |
4.7 |
8.54 |
6.26 |
3.96 |
14.67 |
|
Net Current Assets |
6.76 |
7.88 |
13.24 |
17.15 |
31.2 |
|
Deferred Tax Liabilities |
0.04 |
0.03 |
0.02 |
0.45 |
0.58 |
|
Net Deferred Tax |
-0.04 |
-0.03 |
-0.02 |
-0.45 |
-0.58 |
|
Other Assets |
5.23 |
5.59 |
7.05 |
6.62 |
6.96 |
|
Total Assets |
30.59 |
35.85 |
38.48 |
95.15 |
136.6 |
|
- Other Current Assets |
9.22 |
11.25 |
15.74 |
19.2 |
25.95 |
|
TOTAL ASSETS |
301.68 |
334.62 |
363.4 |
388.42 |
465.53 |
|
Quarterly Income Statement |
201406 |
201409 |
201412 |
201503 |
201506 |
201509 |
201512 E |
201603 E |
|
Net Sales |
21 |
27.08 |
34.47 |
42.3 |
50.56 |
61.09 |
73.92 |
89.44 |
|
Other Income |
0 |
0 |
0 |
0.29 |
0.08 |
0.01 |
0.25 |
0.25 |
|
Total Income |
21 |
27.08 |
34.47 |
42.59 |
50.64 |
61.1 |
74.17 |
89.69 |
|
Total Expenditure |
14.54 |
18.63 |
23.66 |
29.75 |
34.76 |
39.97 |
49.69 |
59.20 |
|
EBIDTA |
6.46 |
8.45 |
10.81 |
12.84 |
15.88 |
21.13 |
24.48 |
30.50 |
|
Depreciation |
2.04 |
2.08 |
2.09 |
2.92 |
3.54 |
5.42 |
5.34 |
6.46 |
|
EBIT |
4.42 |
6.37 |
8.72 |
9.92 |
12.34 |
15.71 |
19.14 |
24.04 |
|
Interest |
0.08 |
0.06 |
0.08 |
0.23 |
0 |
0.02 |
0.33 |
0.31 |
|
PBT |
4.34 |
6.31 |
8.64 |
9.69 |
12.34 |
15.69 |
18.81 |
23.71 |
|
Tax |
0.81 |
1.33 |
1.93 |
1.83 |
2.68 |
3.65 |
4.04 |
5.10 |
|
Adjusted Profit After Tax |
3.53 |
4.98 |
6.71 |
7.86 |
9.66 |
12.04 |
14.76 |
18.61 |
|
Profit/Loss of Associate Company |
0.38 |
0.84 |
1.34 |
1.59 |
2.44 |
3.29 |
3.84 |
4.51 |
|
Adjusted Profit After Extra-ordinary item |
3.91 |
5.82 |
8.05 |
9.45 |
12.1 |
15.33 |
18.60 |
23.12 |
|
|
||||||||
|
EPS |
3.64 |
5.42 |
7.49 |
8.80 |
11.26 |
14.27 |
17.31 |
21.52 |
|
|
||||||||
|
EBIDTA Margin |
30.76% |
31.20% |
31.36% |
30.35% |
31.41% |
34.59% |
33.11% |
34.10% |
|
EBIT Margin |
21.05% |
23.52% |
25.30% |
23.45% |
24.41% |
25.72% |
25.89% |
26.87% |
|
PAT Margin |
18.62% |
21.49% |
23.35% |
22.19% |
23.89% |
25.09% |
25.08% |
25.78% |
|
Yearly Income Statement |
2013 |
2014 |
2015 |
2016 E |
2017 E |
|
Net Sales |
16.77 |
44.06 |
124.85 |
275.01 |
514.71 |
|
Other Income |
0.07 |
0.05 |
0.29 |
0.59 |
0.10 |
|
Other Operating Income |
0.00 |
0.00 |
0.00 |
0.00 |
0.00 |
|
Total Income |
16.84 |
44.11 |
125.14 |
275.60 |
514.81 |
|
Total Expenditure |
13.51 |
30.25 |
86.58 |
183.62 |
335.85 |
|
EBIDTA |
3.33 |
13.86 |
38.56 |
91.98 |
178.96 |
|
Depreciation |
0.75 |
4.30 |
9.13 |
20.76 |
36.55 |
|
EBIT |
2.58 |
9.56 |
29.43 |
71.22 |
142.41 |
|
Interest |
0.00 |
0.38 |
0.45 |
0.68 |
0.68 |
|
PBT |
2.58 |
9.18 |
28.98 |
70.54 |
141.73 |
|
Tax |
0.33 |
1.74 |
5.90 |
15.47 |
30.47 |
|
Deferred Tax |
0.00 |
0.00 |
0.00 |
0.00 |
0.00 |
|
Adjusted Profit After Tax |
2.25 |
7.44 |
23.08 |
55.07 |
111.26 |
|
Minority Interest After NP |
0.00 |
0.00 |
0.00 |
0.00 |
0.00 |
|
Profit/Loss of Associate Company |
0.00 |
0.35 |
4.15 |
14.08 |
19.92 |
|
Extra-ordinary Items |
0.00 |
0.00 |
0.00 |
0.00 |
0.00 |
|
Adjusted Profit After Extra-ordinary item |
2.25 |
7.79 |
27.23 |
69.15 |
131.18 |
|
|
|||||
|
Equity |
10.04 |
10.04 |
10.34 |
10.04 |
10.04 |
|
Face Value |
10 |
10 |
10 |
10 |
10 |
|
Outstanding Shares |
10744102 |
10744102 |
10744102 |
10744102 |
10744102 |
|
EPS (Unit Curr.) |
0.00 |
7.25 |
25.34 |
64.36 |
122.10 |
|
|
|||||
|
EBIDTA Margin |
19.86% |
31.46% |
30.89% |
33.45% |
34.77% |
|
EBIT Margin |
15.38% |
21.70% |
23.57% |
25.90% |
27.67% |
|
PAT Margin |
13.36% |
17.66% |
21.76% |
25.09% |
25.48% |
- Share :


Post a Comment
|
DISCLAIMER |
This report is only for the information of our customers. Recommendations, opinions, or suggestions are given with the understanding that readers acting on this information assume all risks involved. The information provided herein is not to be construed as an offer to buy or sell securities of any kind. ATS and/or its group companies do not as assume any responsibility or liability resulting from the use of such information.